Sensei is a brand new Mac app that monitors the status of various components of your Mac’s hardware and provides a set of utilities to optimize its performance. The app is certainly not the first to offer these features – there are tools built into macOS and third-party apps that can accomplish many of the same functions, and in some cases more. However, what sets Sensei apart, and what has quickly won me over, is its ability to translate the data it collects and implement its utilities in a beautifully-designed, standalone app.
Sensei is a single-window app that’s divided into a navigation panel on the left and pane on the right. The panel has three sections: the Dashboard, Utilities, and Hardware. Clicking on a section displays information about it in the pane on the right. There’s also a Settings option at the bottom of the lefthand pane that controls light and dark mode and toggling automatic updates on or off.
Dashboard
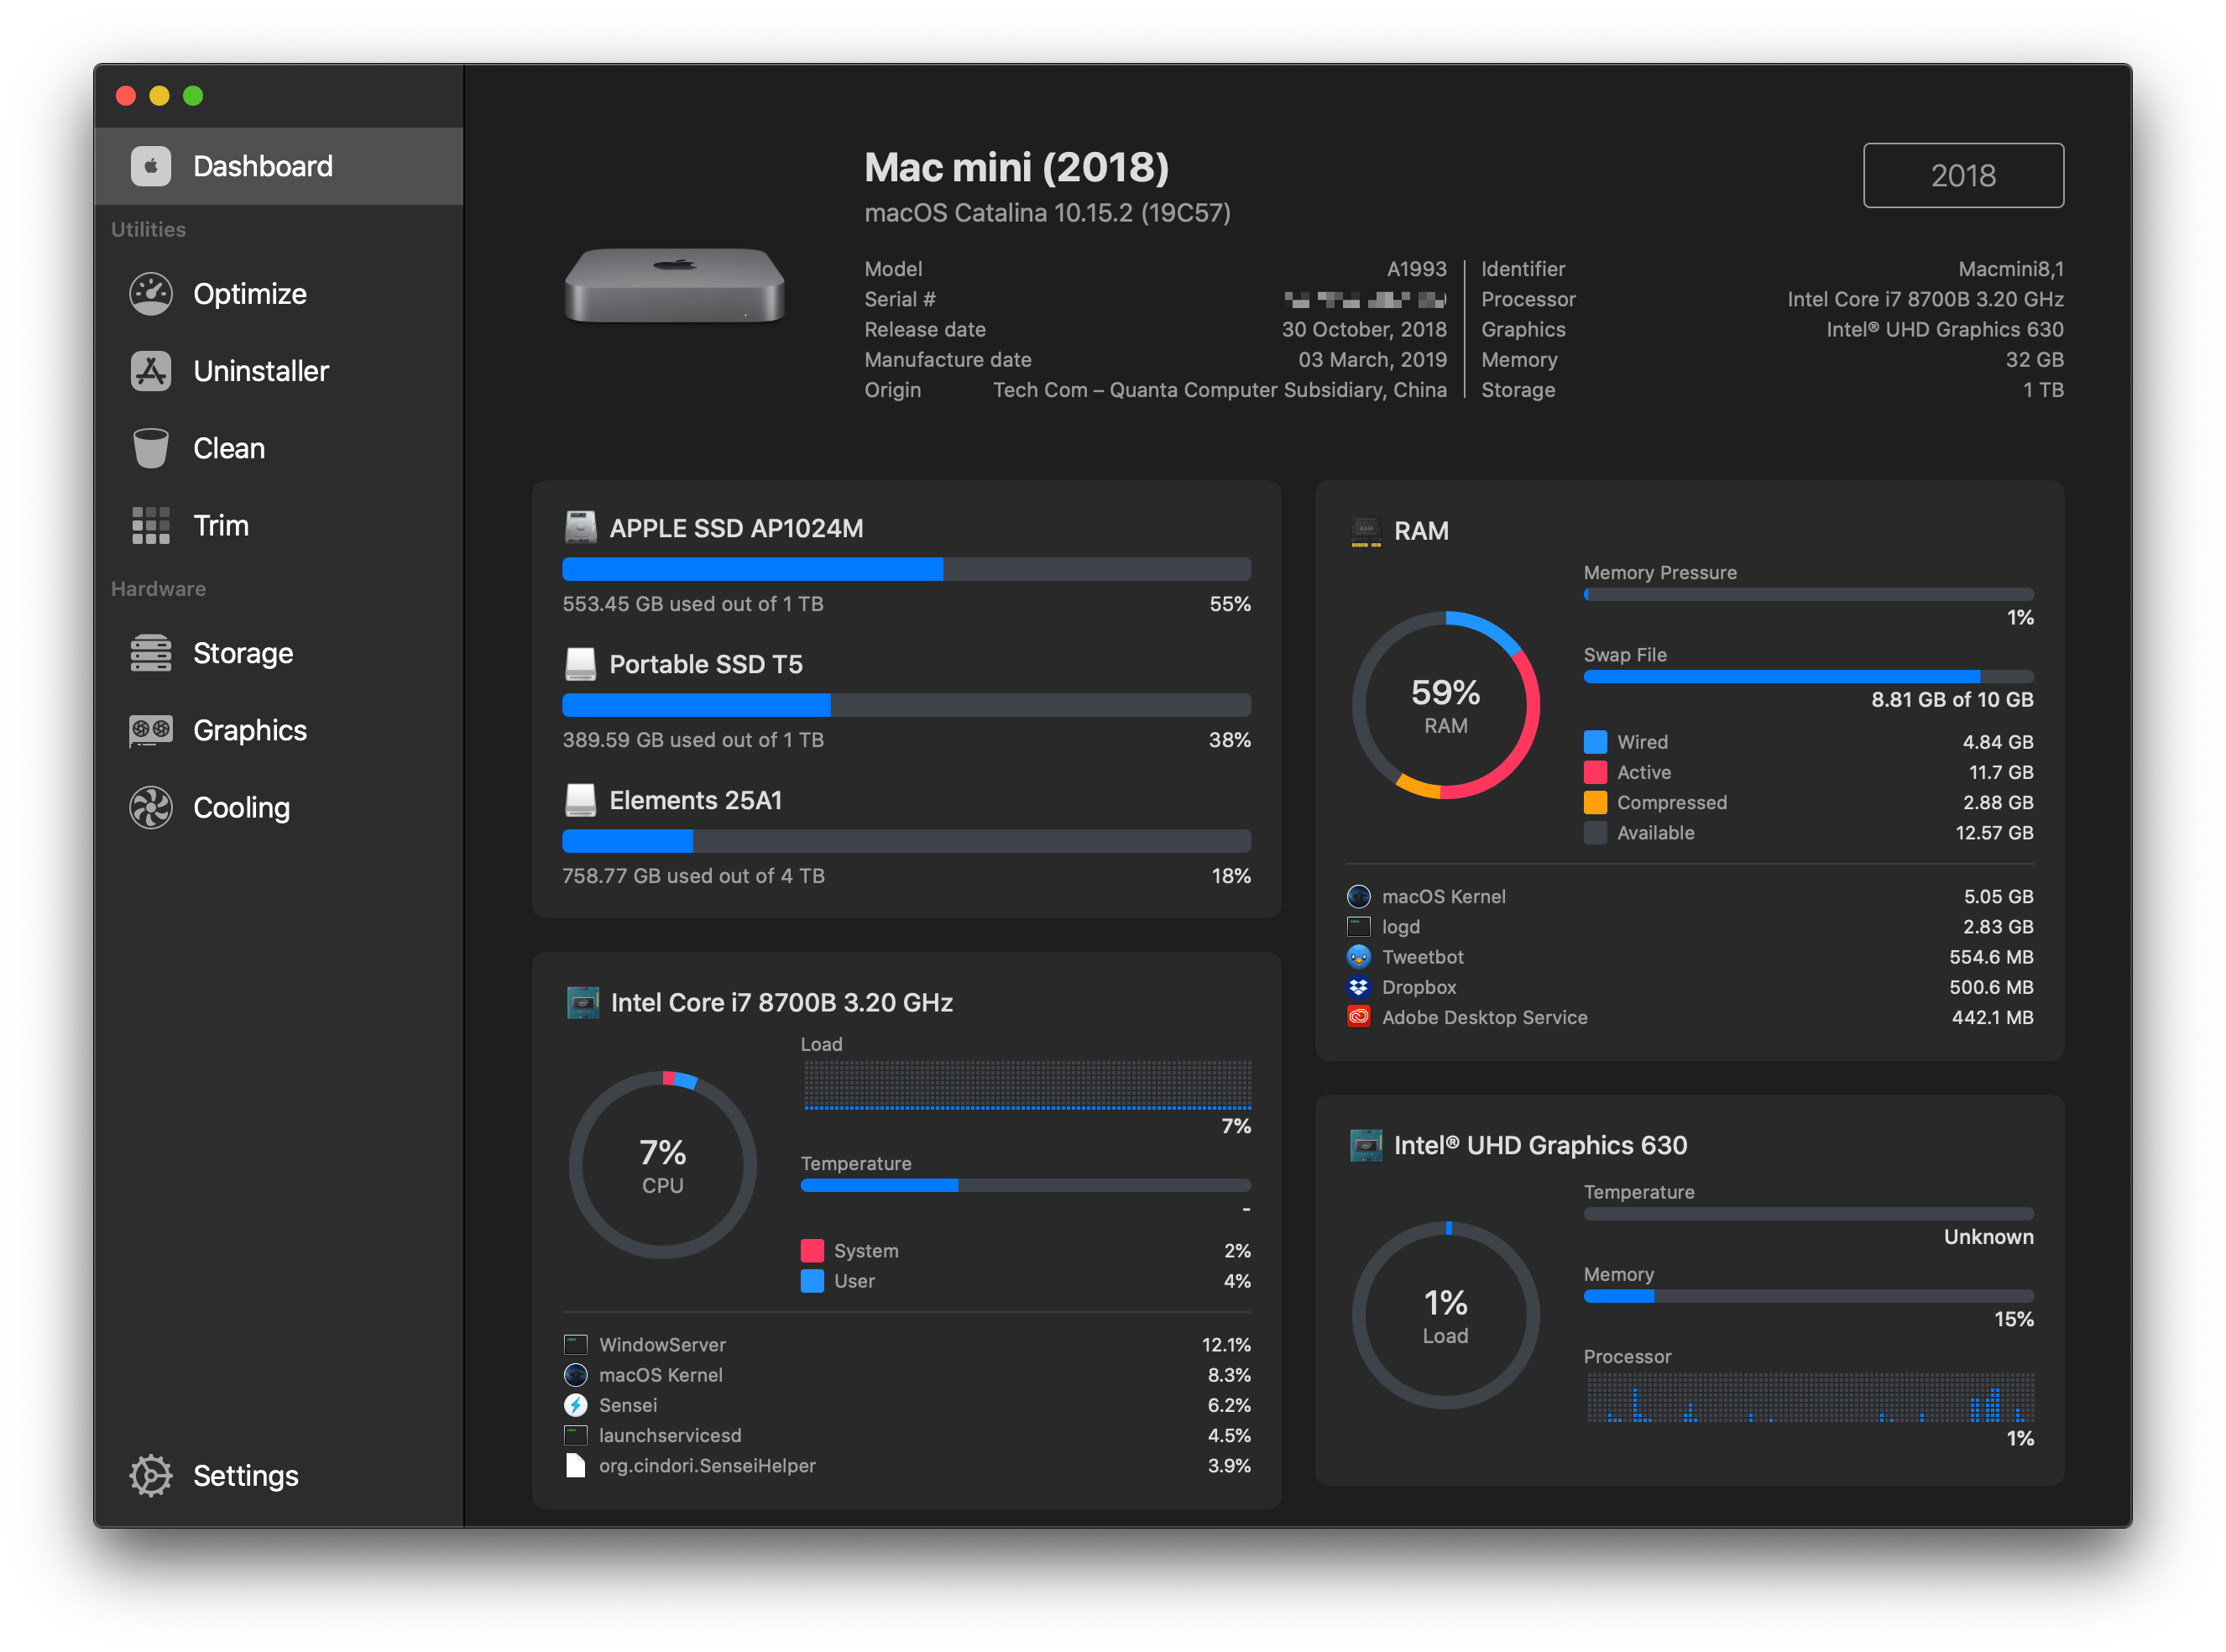
As you’d expect, the Dashboard section of Sensei provides an overview of your system with details about the type of Mac you’re using as well as its storage, RAM, CPU, and graphics. At the top is the basic information about your Mac, including its official name, model number, the version of macOS it’s running, serial number, CPU, graphics, memory, storage, and other details. It’s a handy list to have when you’re consulting support documentation or comparing your machine’s specs to another Mac.
The storage section reports the capacity and amount of space used for your Mac’s internal and external drives. I have a built-in 1TB SSD in my Mac mini as well as a 4TB portable HDD that’s partitioned with 3TB allocated to Time Machine and 1TB assigned to Project Files. I also have a 1TB portable SSD connected to my Mac mini that I use for my photo library.
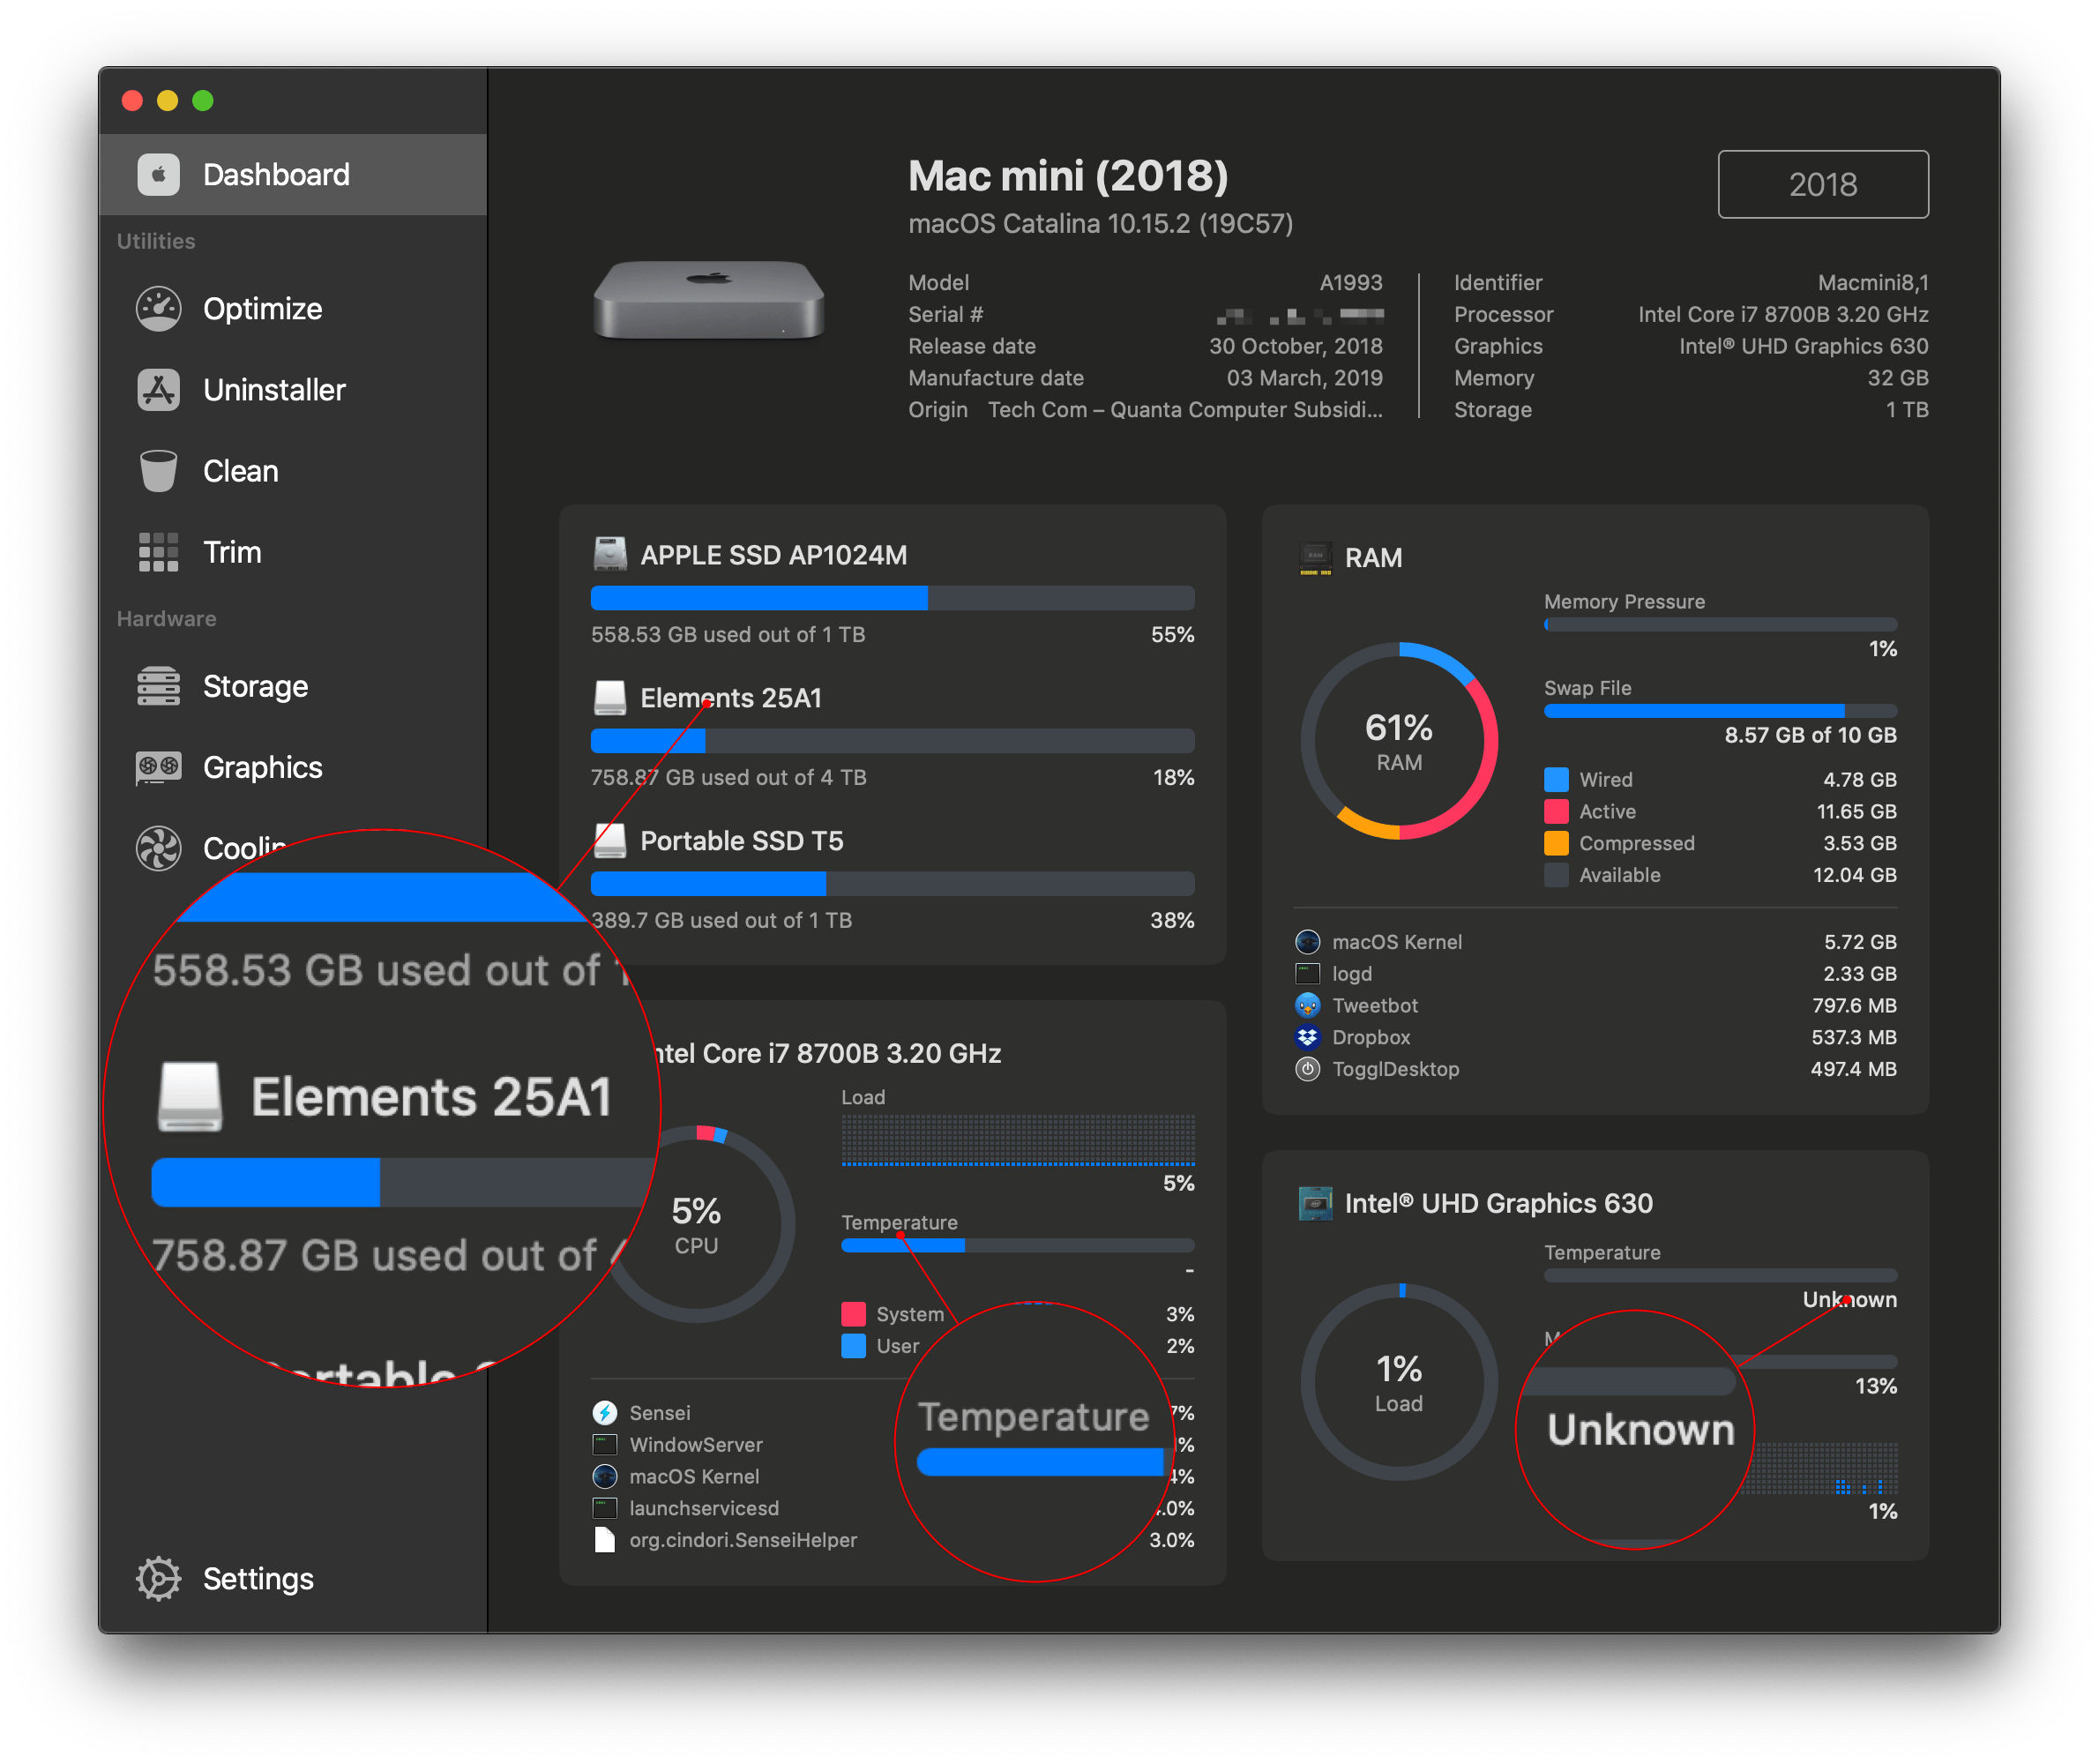
In my testing, the Dashboard misreported one of my external drives and didn’t report the temperature of my CPU or graphics system.
For my internal and external SSDs, Sensei’s bar graphs have been a nice way to get a sense of how full each drive is. Unfortunately, the app doesn’t properly report how much of my external 4TB drive is full. That HDD, which is named Elements 25A1 in the screenshot above, has nearly 3TB of Time Machine backups stored on it, but the app only shows the amount of storage used by the Project Files partition. Hopefully, this is a bug that gets addressed soon.
The sections of the Dashboard related to RAM and CPU use circular graphs depicting the load on each and the type of use. Those sections also display a continuously-updating list of apps and processes that are using the most RAM and CPU resources. Finally, the graphics section displays the load on the GPU, its memory, and its temperature.
There’s a separate section of Sensei that reports cooling details, but it doesn’t appear those are properly reflected in the Dashboard. The temperature graph of my CPU hasn’t changed during my testing and doesn’t report a value. In addition, the temperature of the built-in Intel graphics in my mini is reported as ‘Unknown.’
Aside from what appear to be storage and temperature reporting bugs, Sensei’s Dashboard strikes an excellent balance that provides a glanceable overview of your Mac’s systems without getting lost in the weeds with details. It’s the sort of information that can help you begin to understand what is going on if your Mac seems to be struggling unexpectedly, for example. One thing I discovered during my testing that was unexpected is that the animated fan icon in the Home app’s UI uses 75% of my Mac mini’s graphics resources when it’s visible onscreen, which is not great to say the least.
One thing I’d love to see added to the Dashboard in the future is a button that would take me directly to more information about each section of the dashboard. The app already has dedicated sections for storage and graphics that could be linked to the Dashboard, and CPU and RAM sections that could also be linked; providing more detailed information about how each is being used would be welcome too.
Utilities
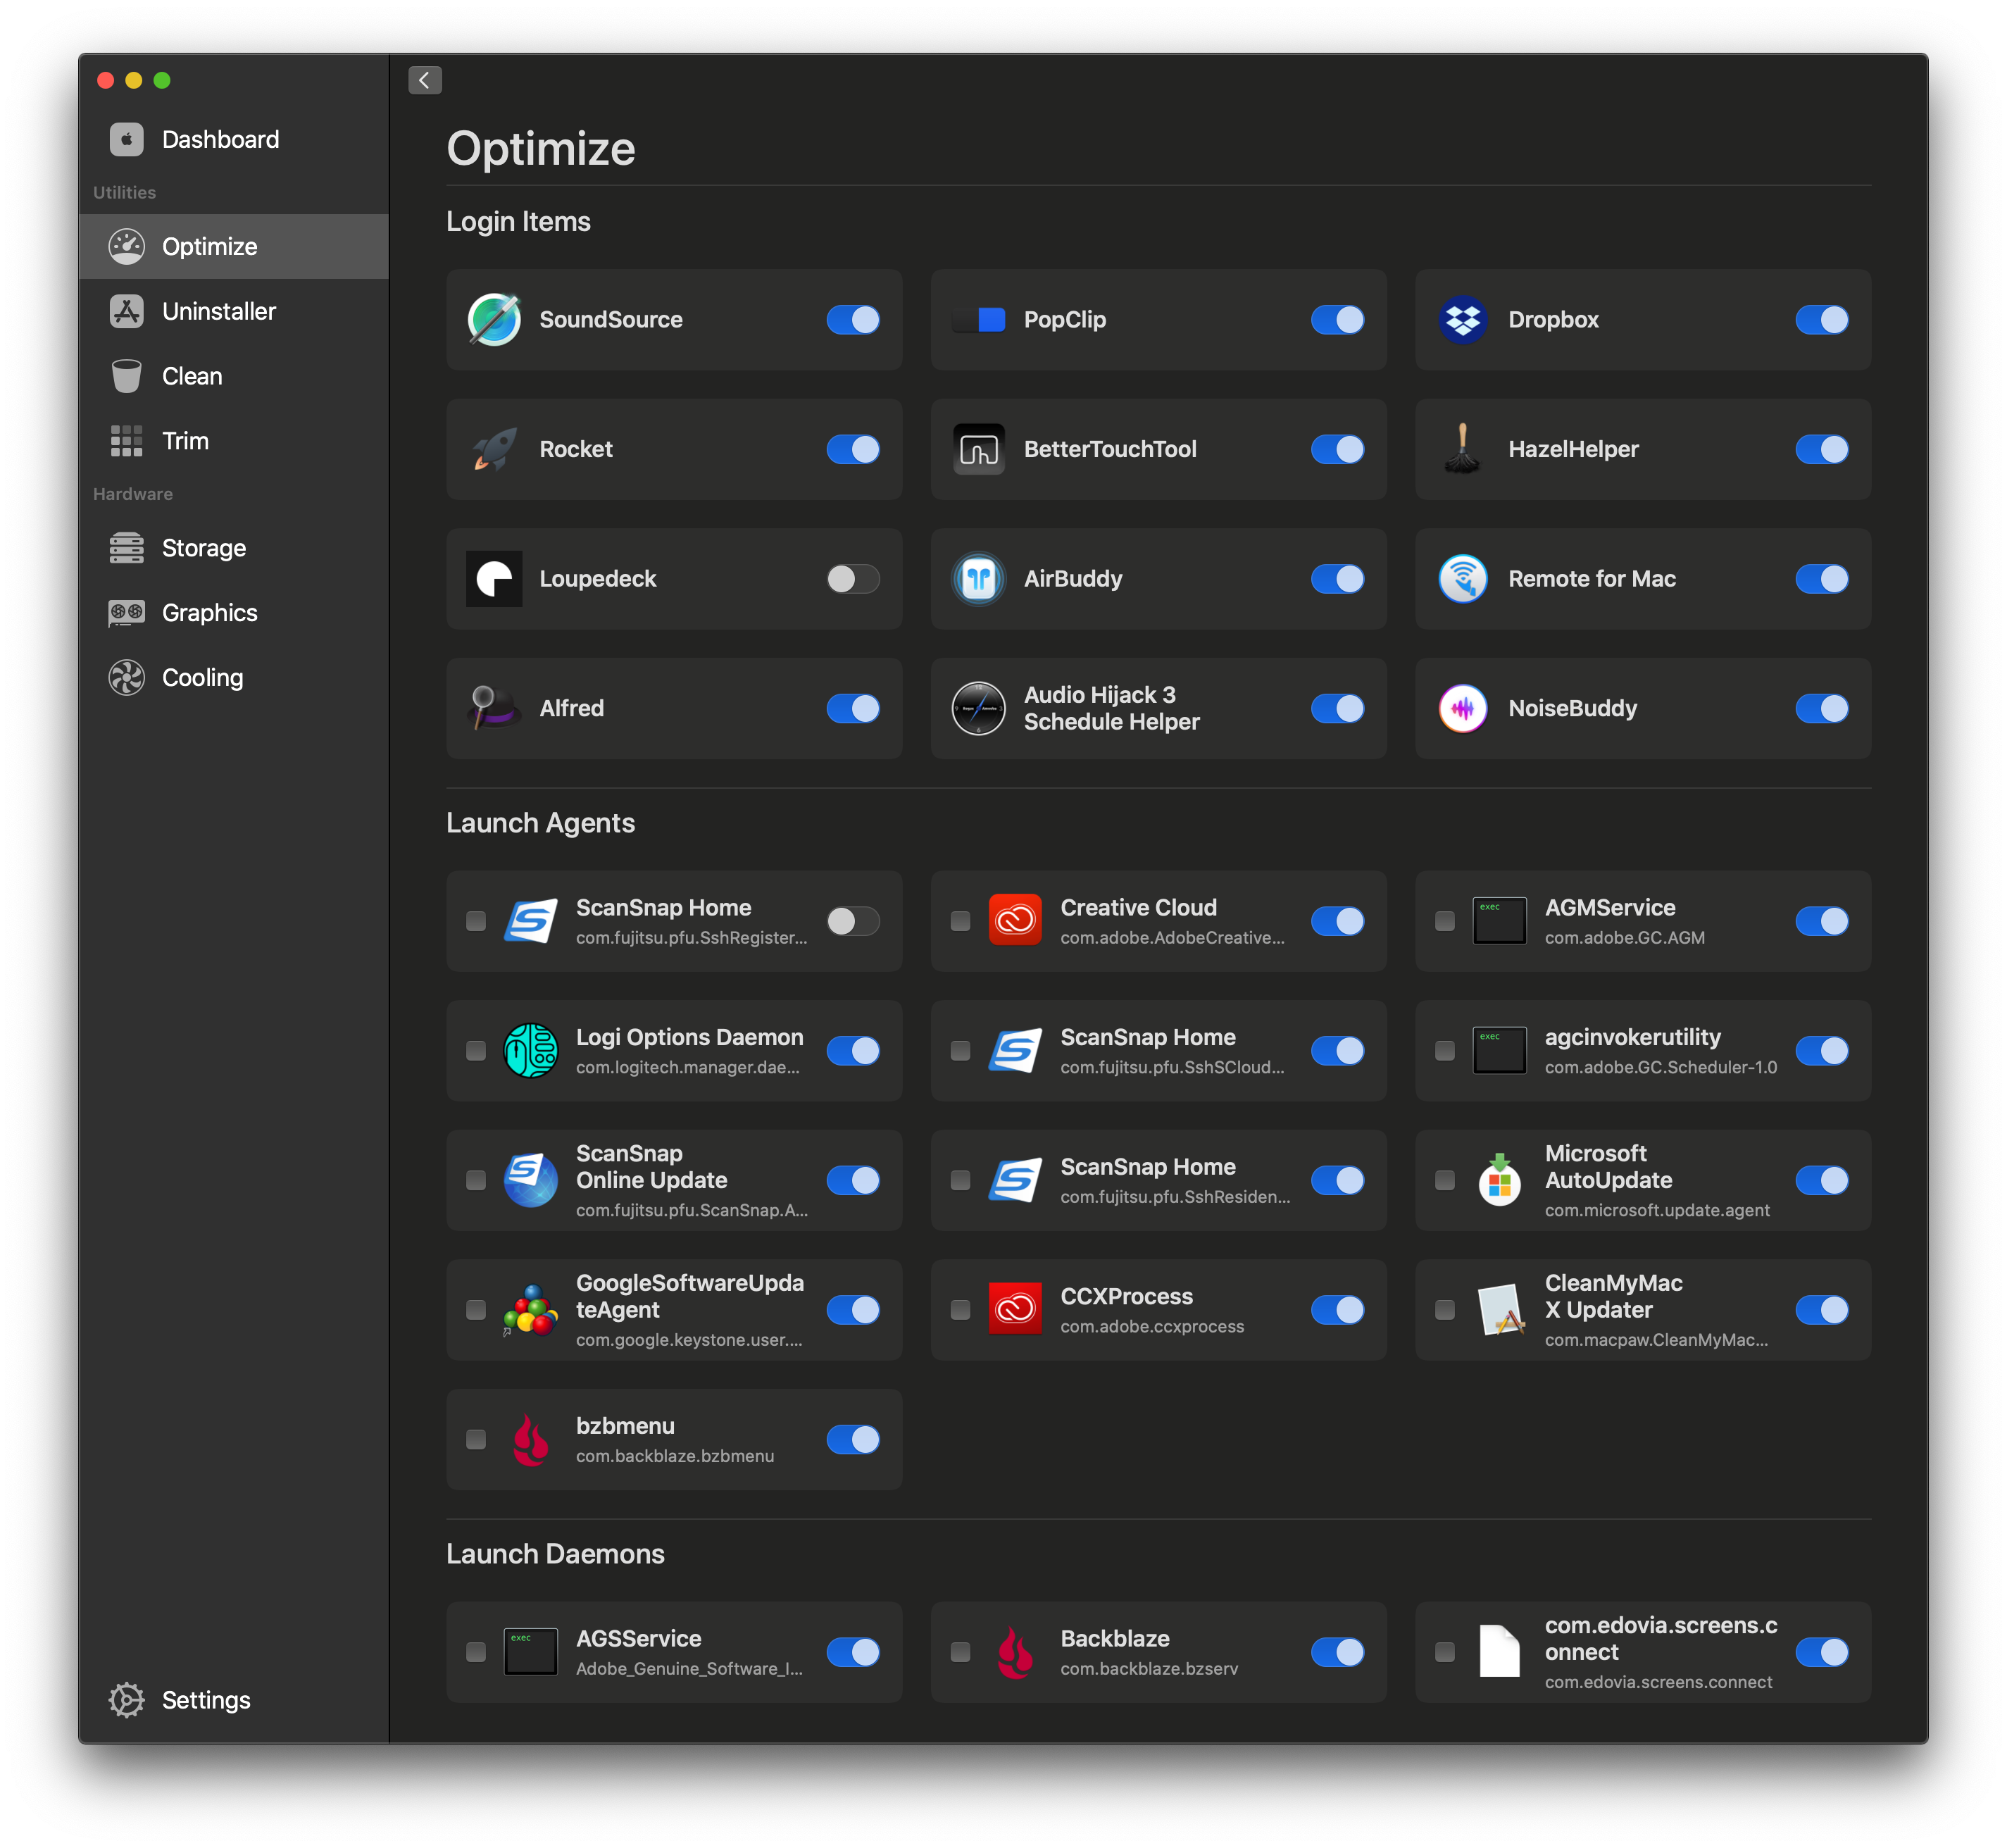
You can toggle login items, launch agents, and launch daemons on and off and also delete the latter two.
Sensei’s next section includes four utilities: Optimize, Uninstaller, Clean, and Trim. Optimize provides a one-stop destination for turning login items, launch agents, and launch daemons on or off. Launch agents and daemons can also be deleted instead of just turned off.
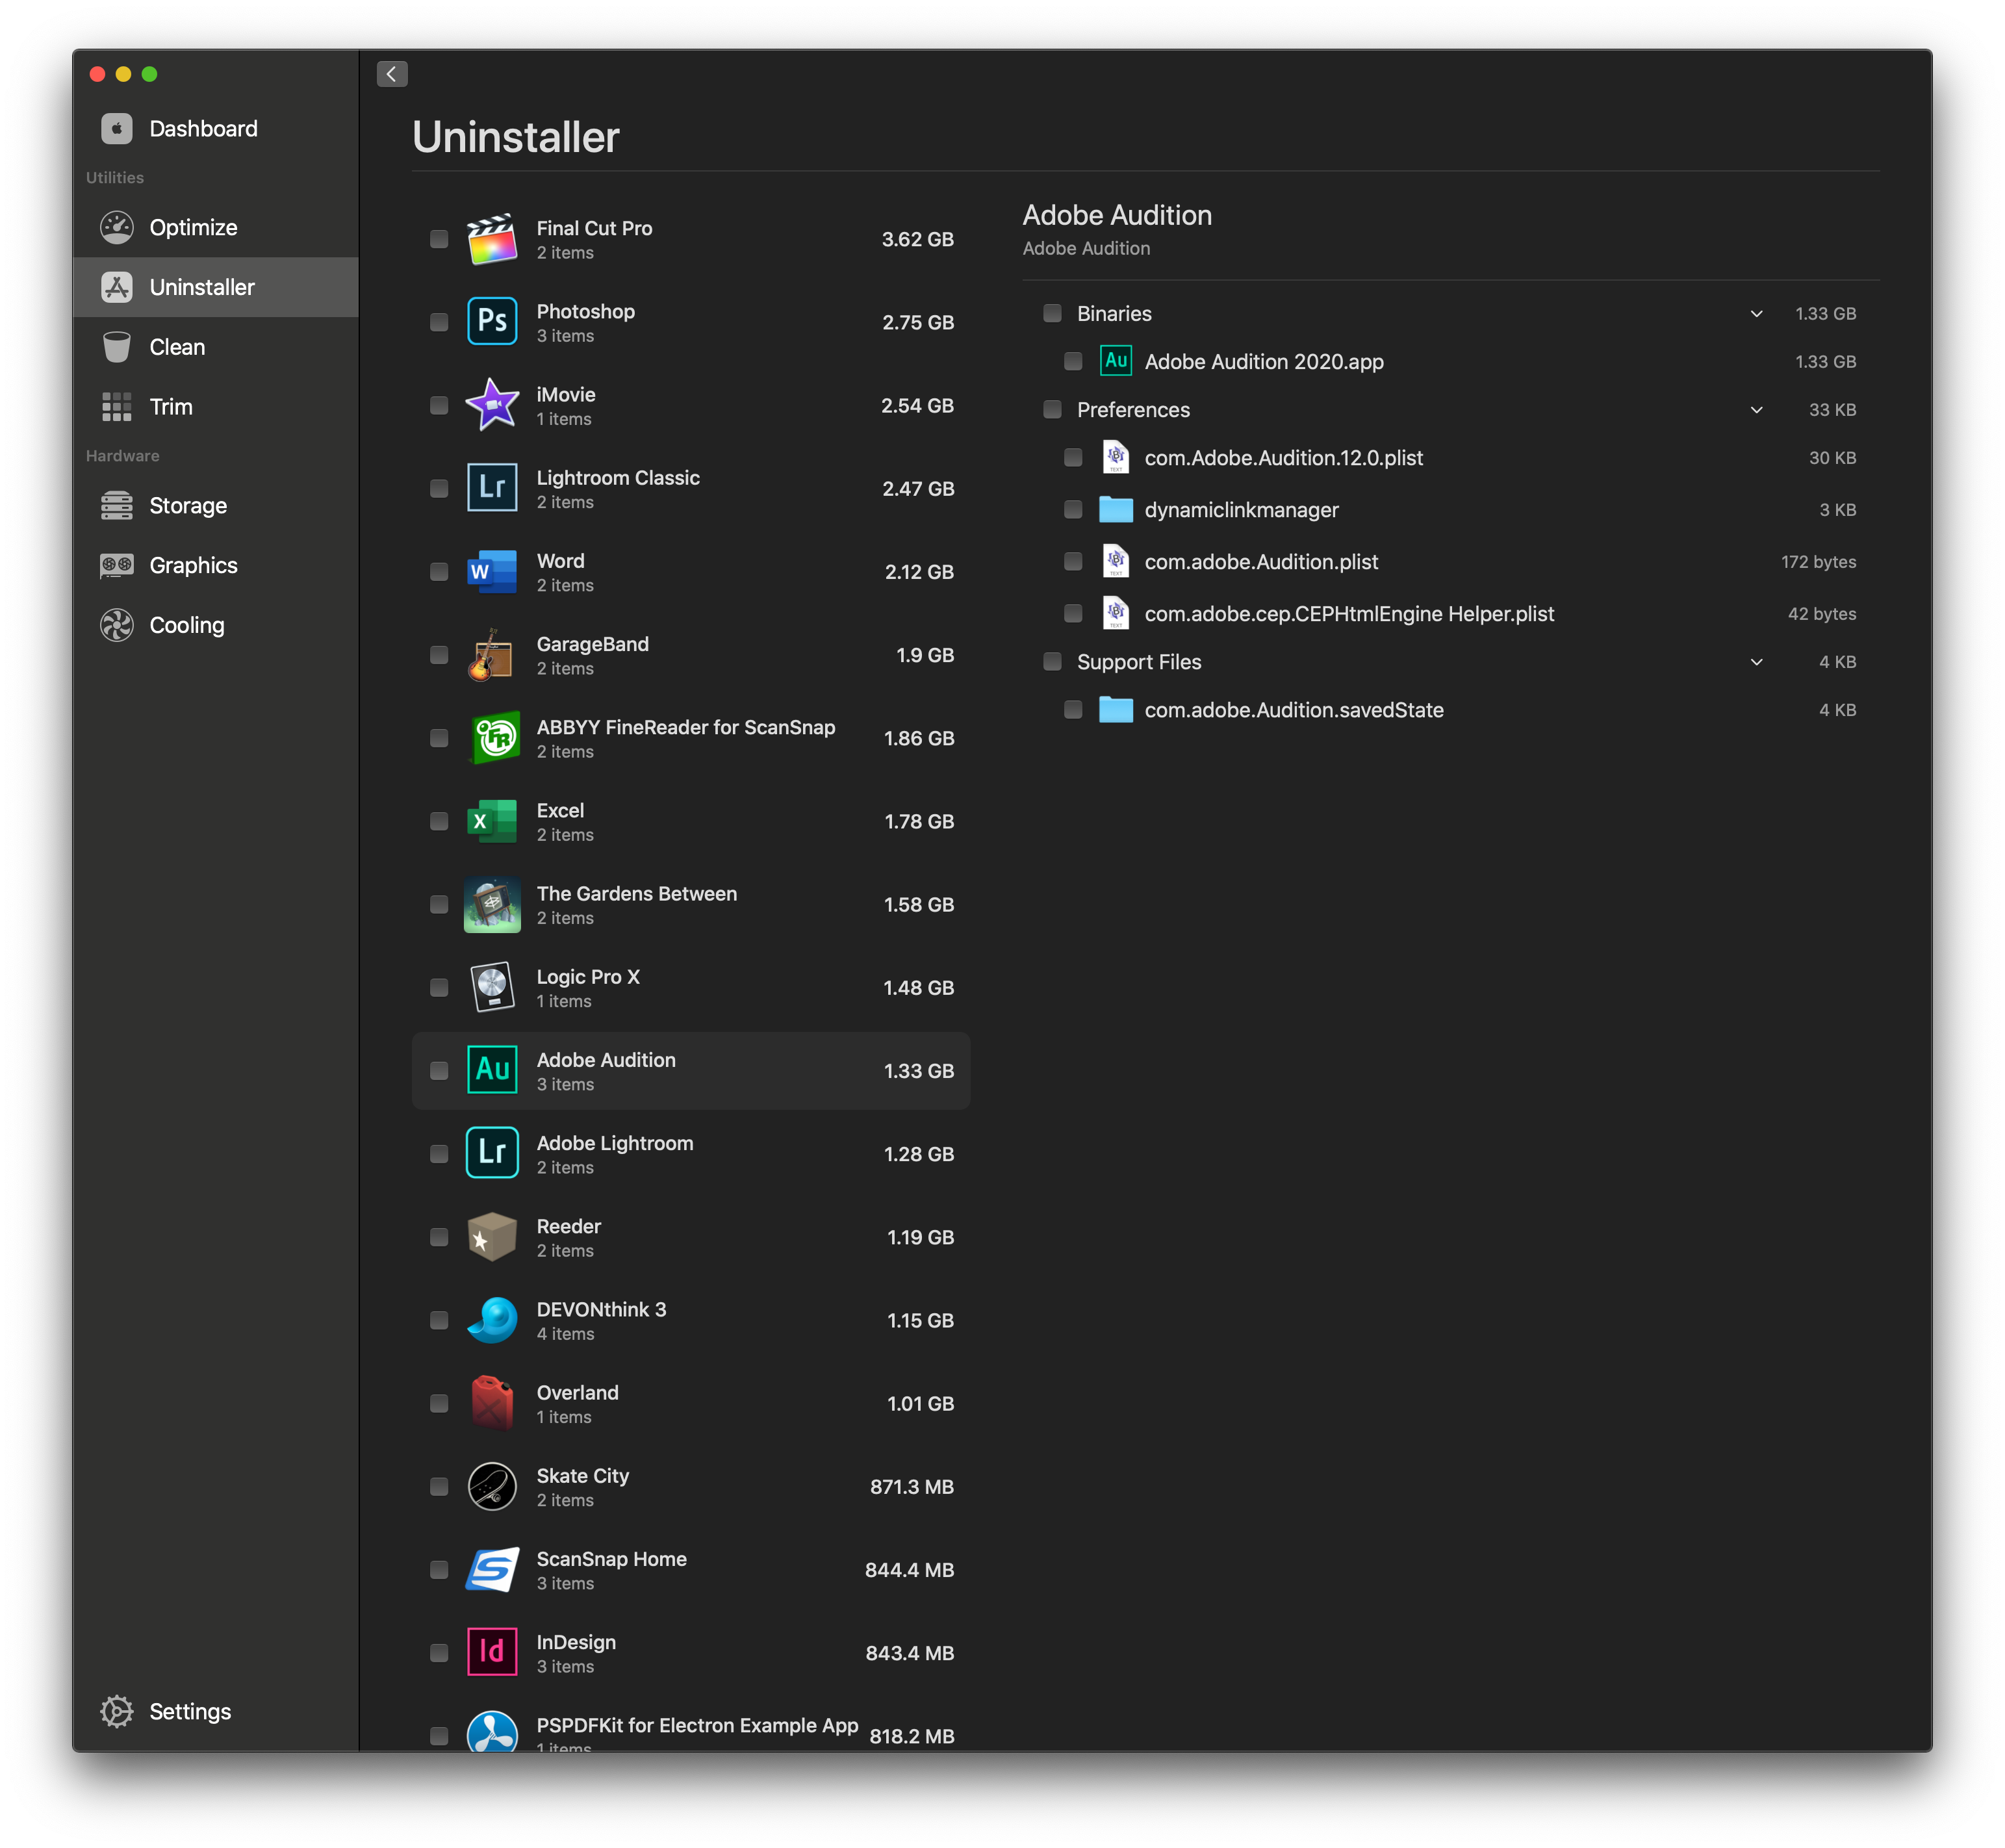
Sensei’s Uninstaller scans your Mac to create a list of the apps you have installed and their size. Selecting an app reveals its app bundle and any Support Files, Preferences, Containers, and other related files and folders. Right-clicking on a file or folder provides additional options like viewing it in the Finder or previewing it. You can click the checkbox next to an app to delete it and all associated files and folders or pick and choose each of the elements you want to move to your Mac’s Trash.
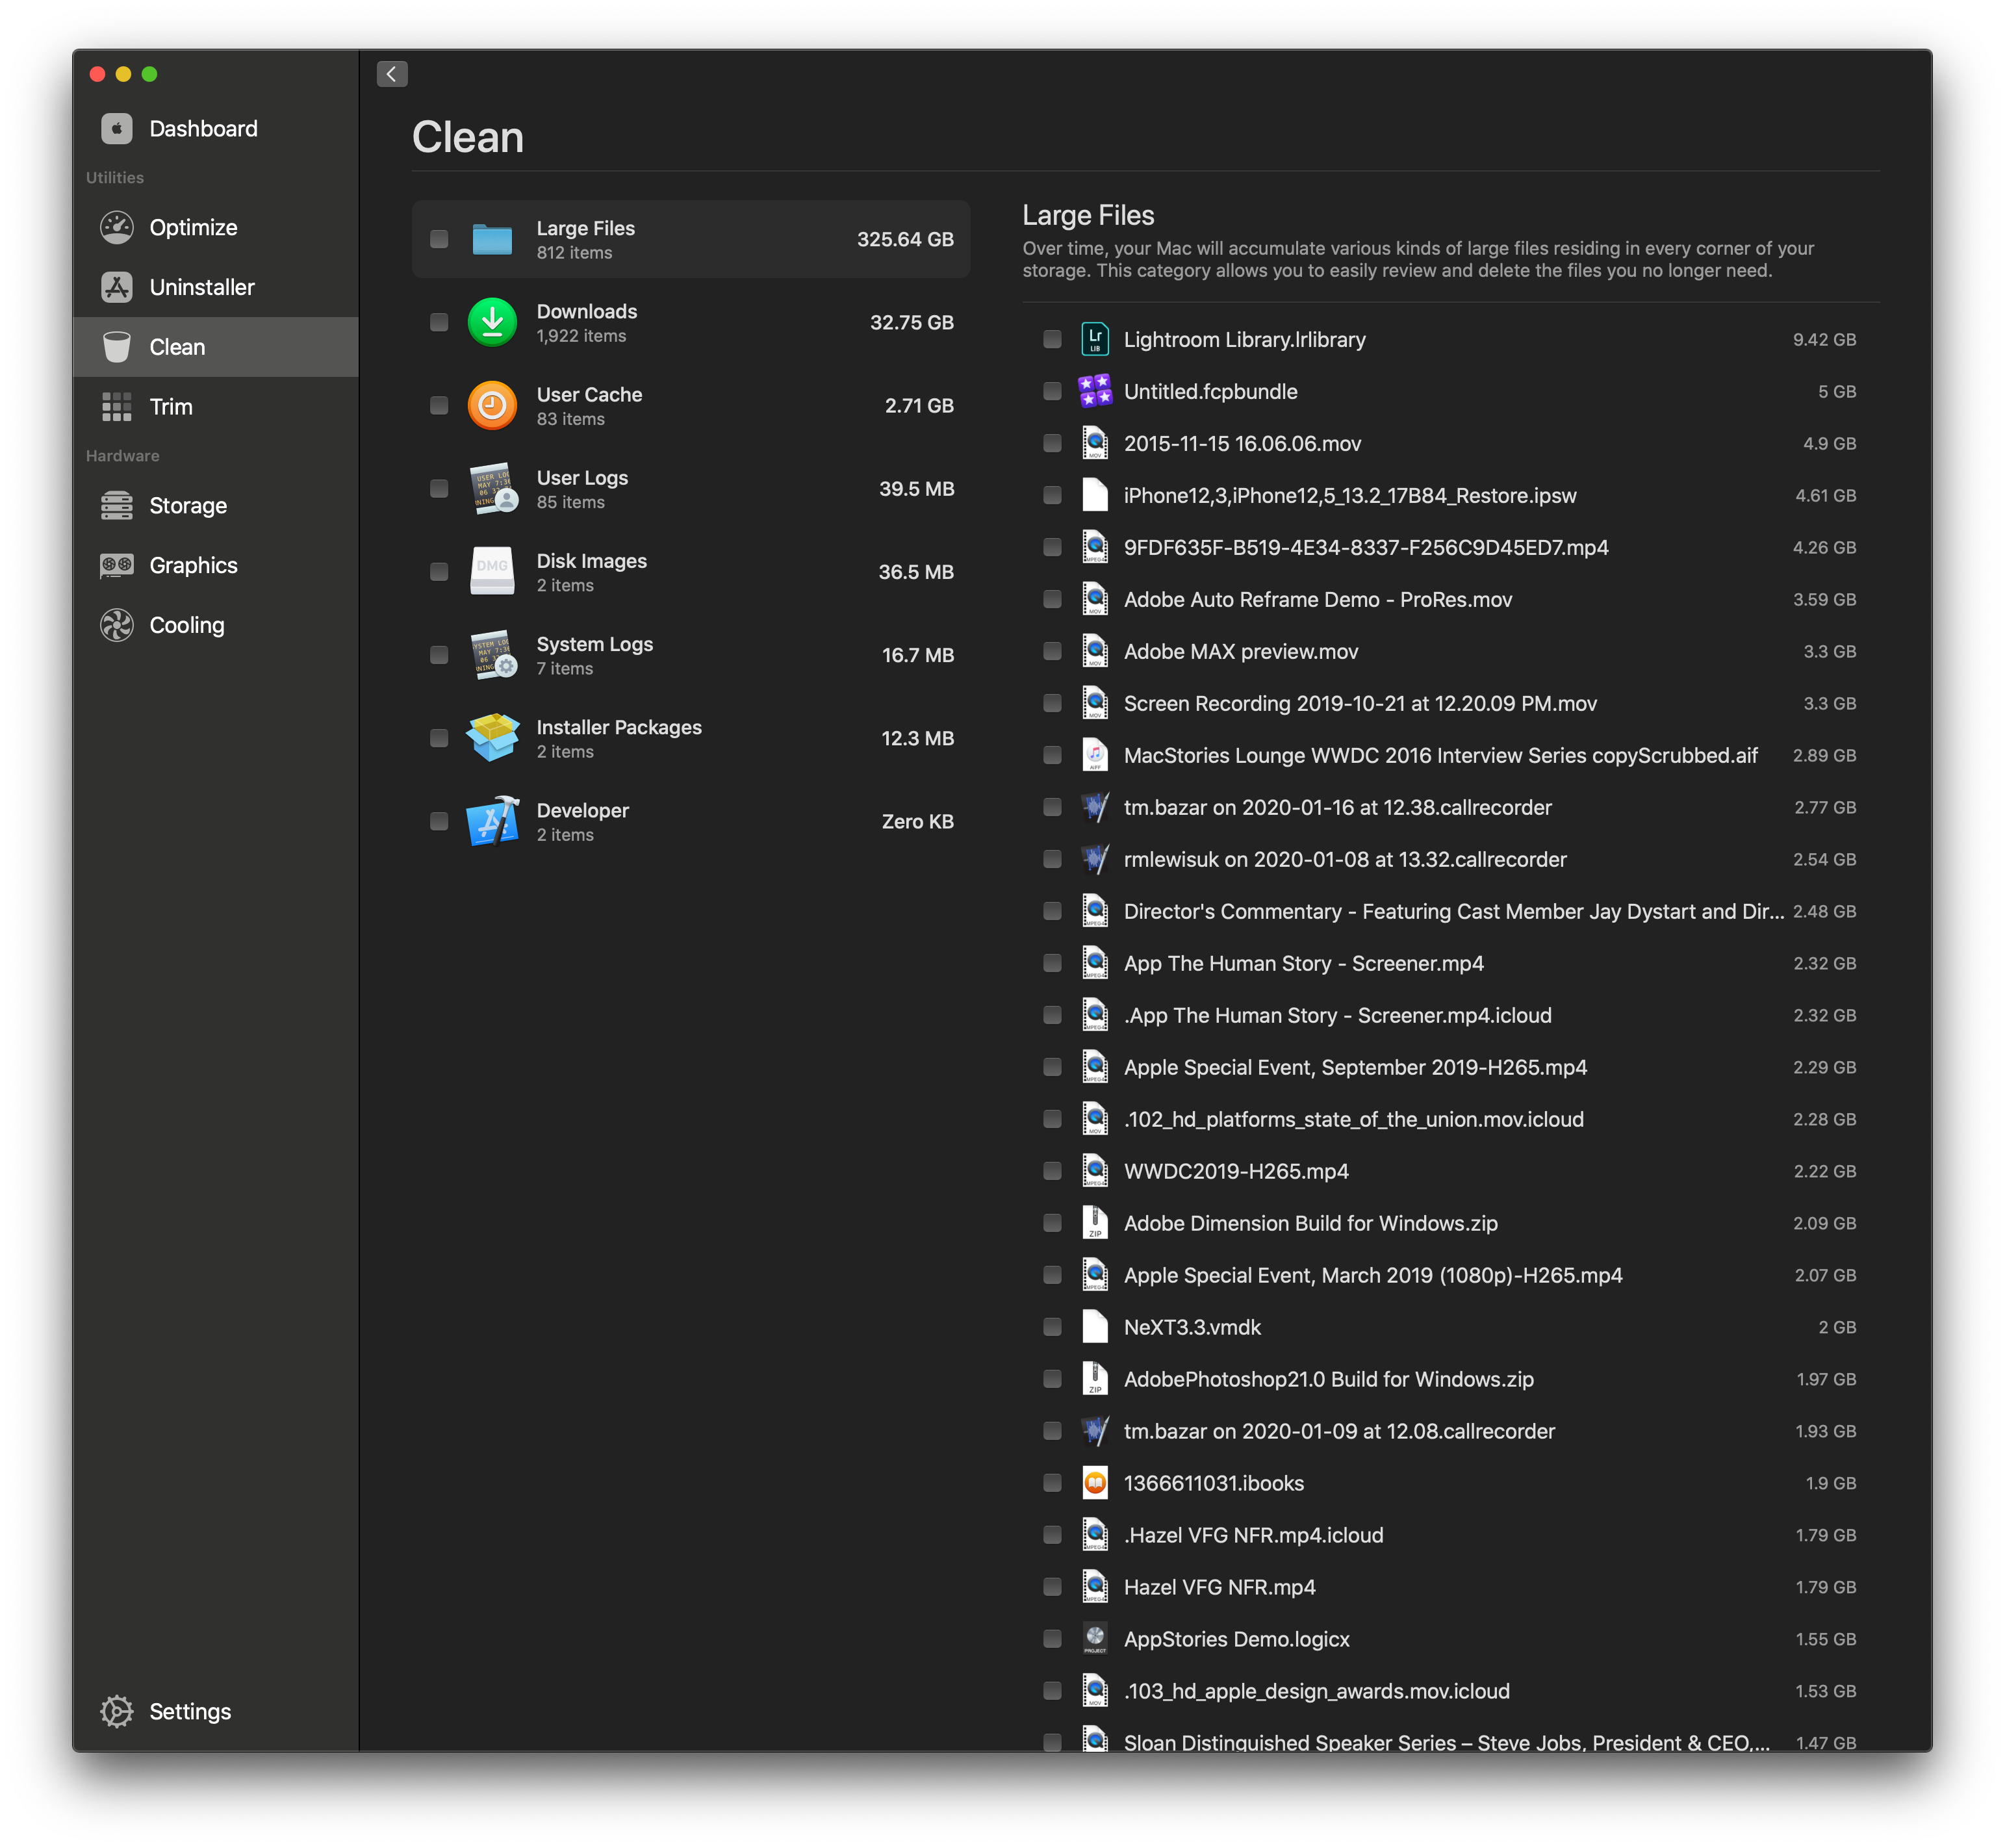
The Clean section scans your Mac for large files, Downloads, User Caches, User Logs, Disk Images, System Logs, Installer Packages, Developer files, and other categories of files you may be able to delete. Each category is sorted by size, making it a fast way to find big files that will free up space. There are other third-party apps that do more to map your Mac’s storage visually, like Daisy Disk and CleanMyMac, but Sensei’s Clean utility is still an effective way to track down the biggest files that are taking up significant amounts of storage.
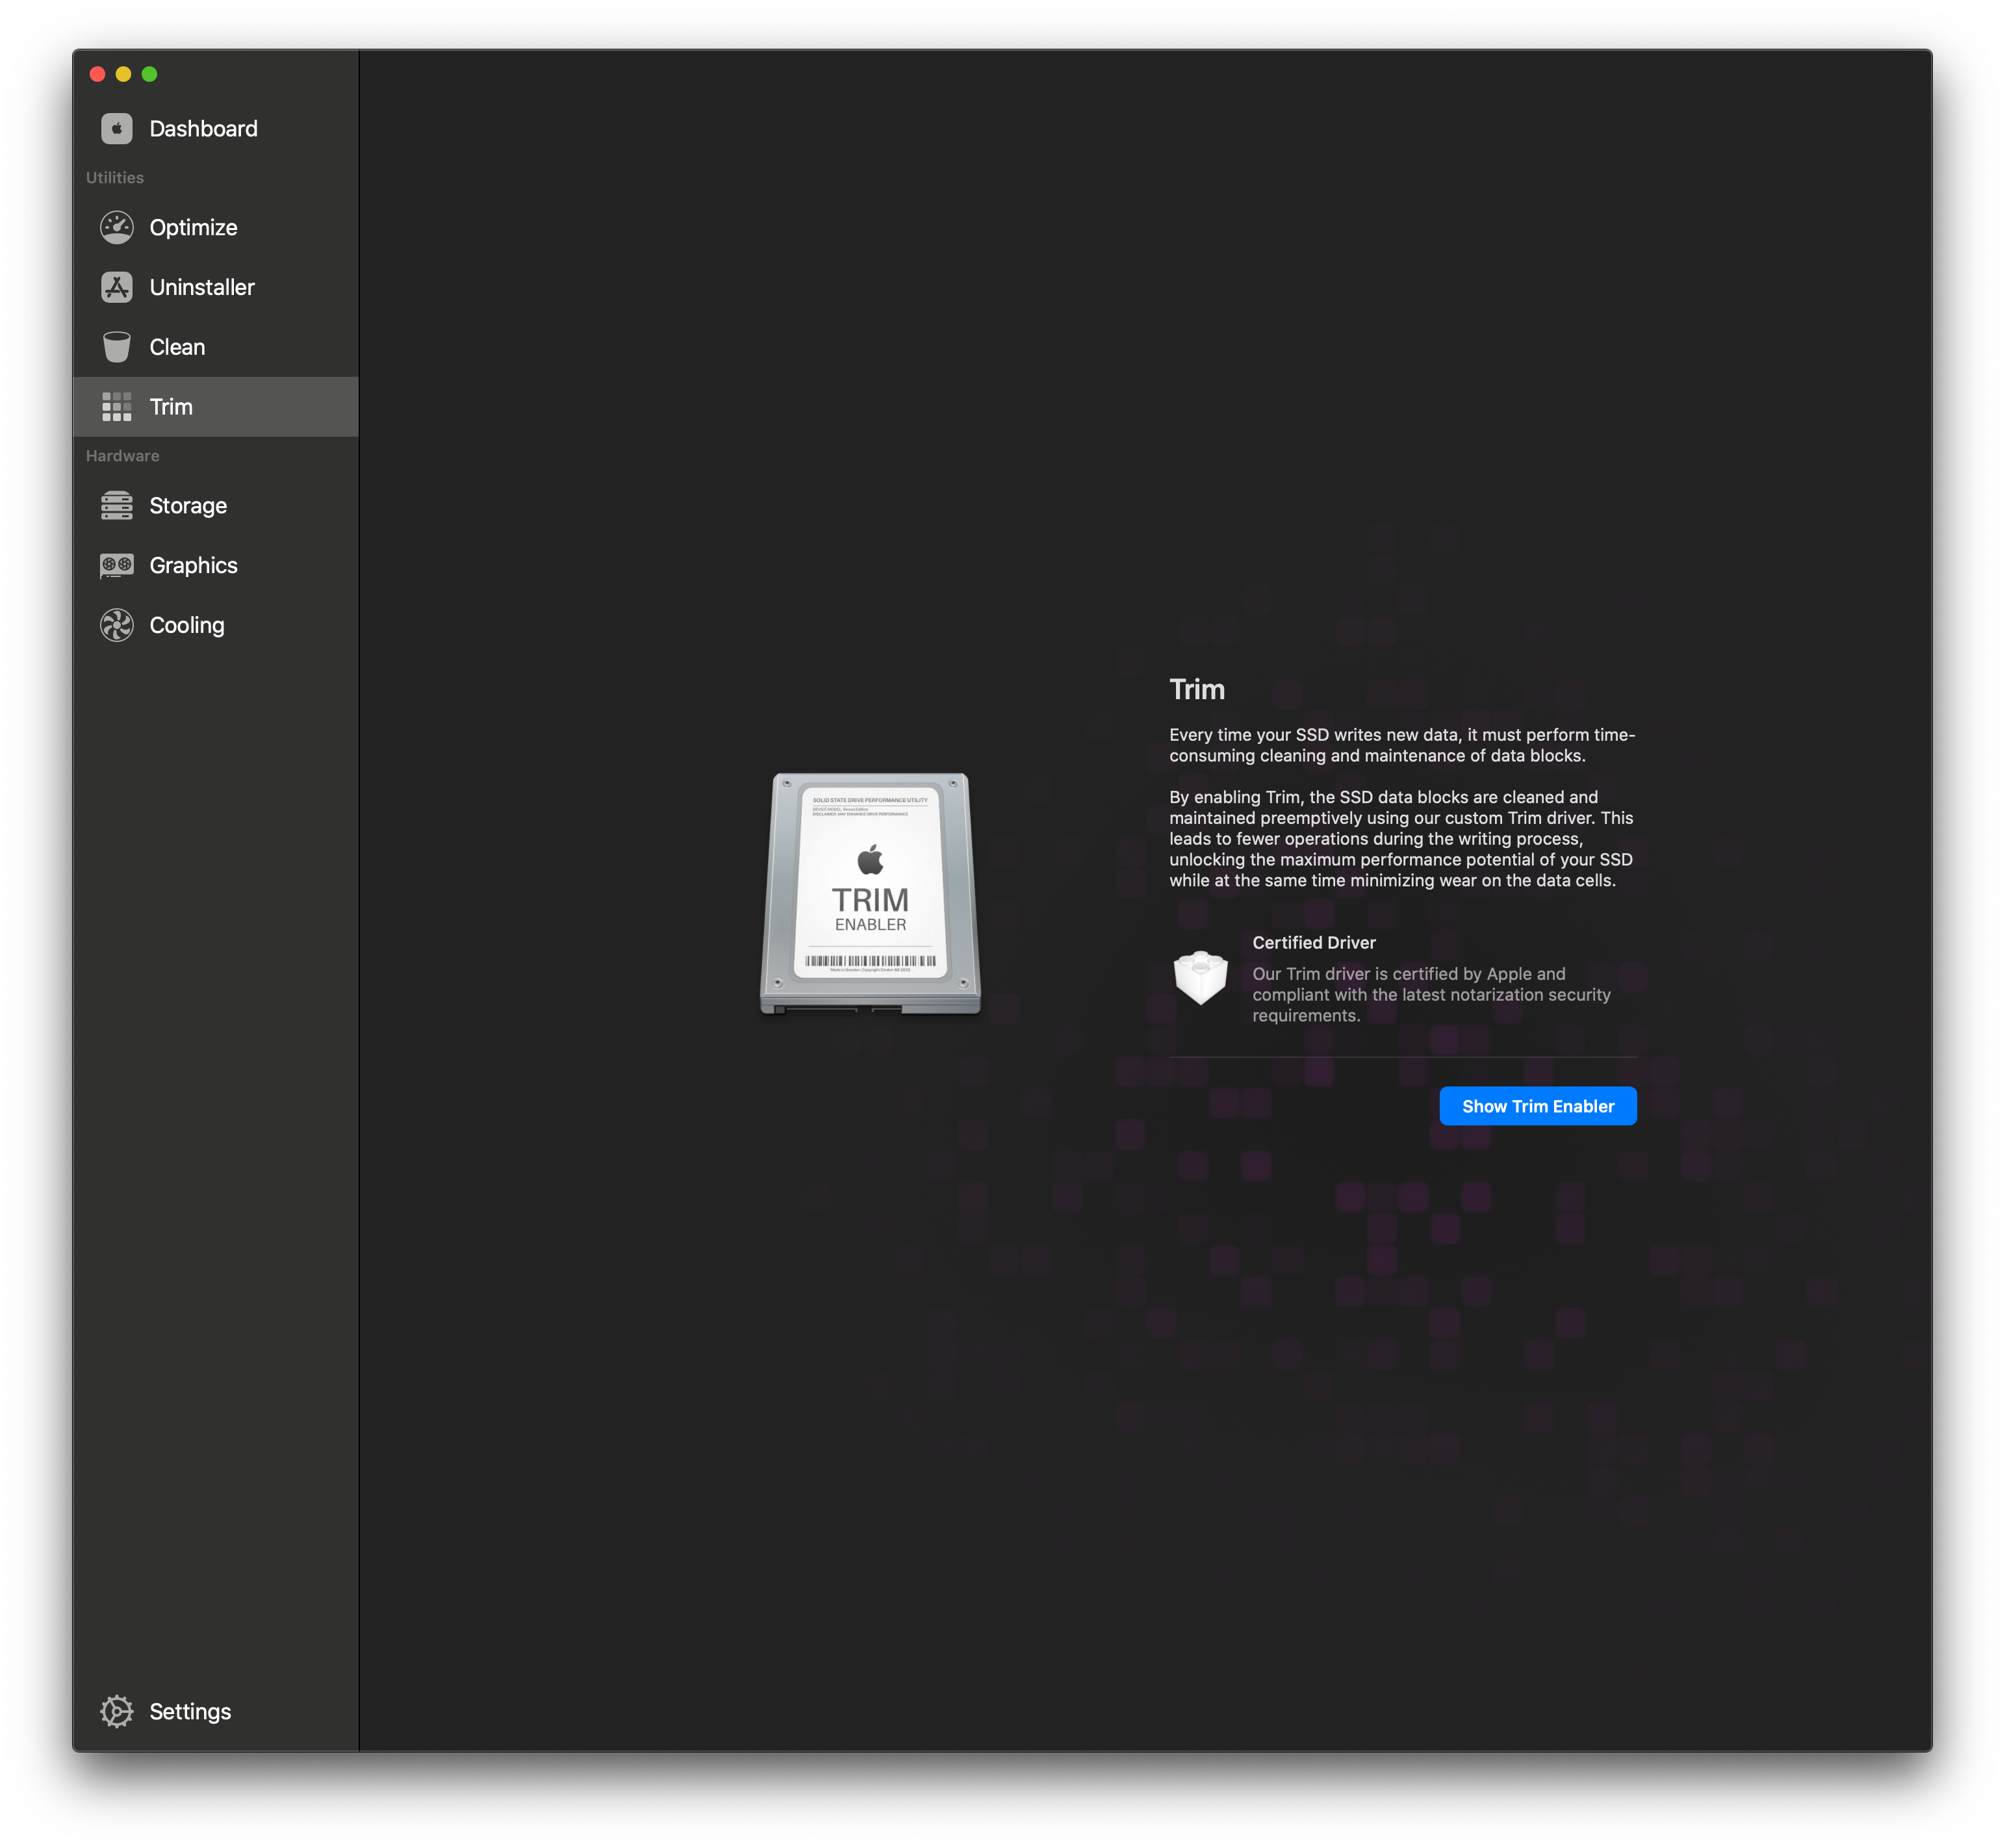
Trim is the simplest of all of Sensei’s tools to use. It’s just a toggle that, when turned on, enables the developer’s Apple-certified Trim driver that automatically cleans and maintains the data blocks on any internal SSD in your Mac. The developer says it maximizes the performance of your SSD. I enabled Trim and would like to think it will make a difference in the long-term performance of my Mac mini’s SSD, but it’s not the kind of thing you turn on and notice immediately.
Hardware
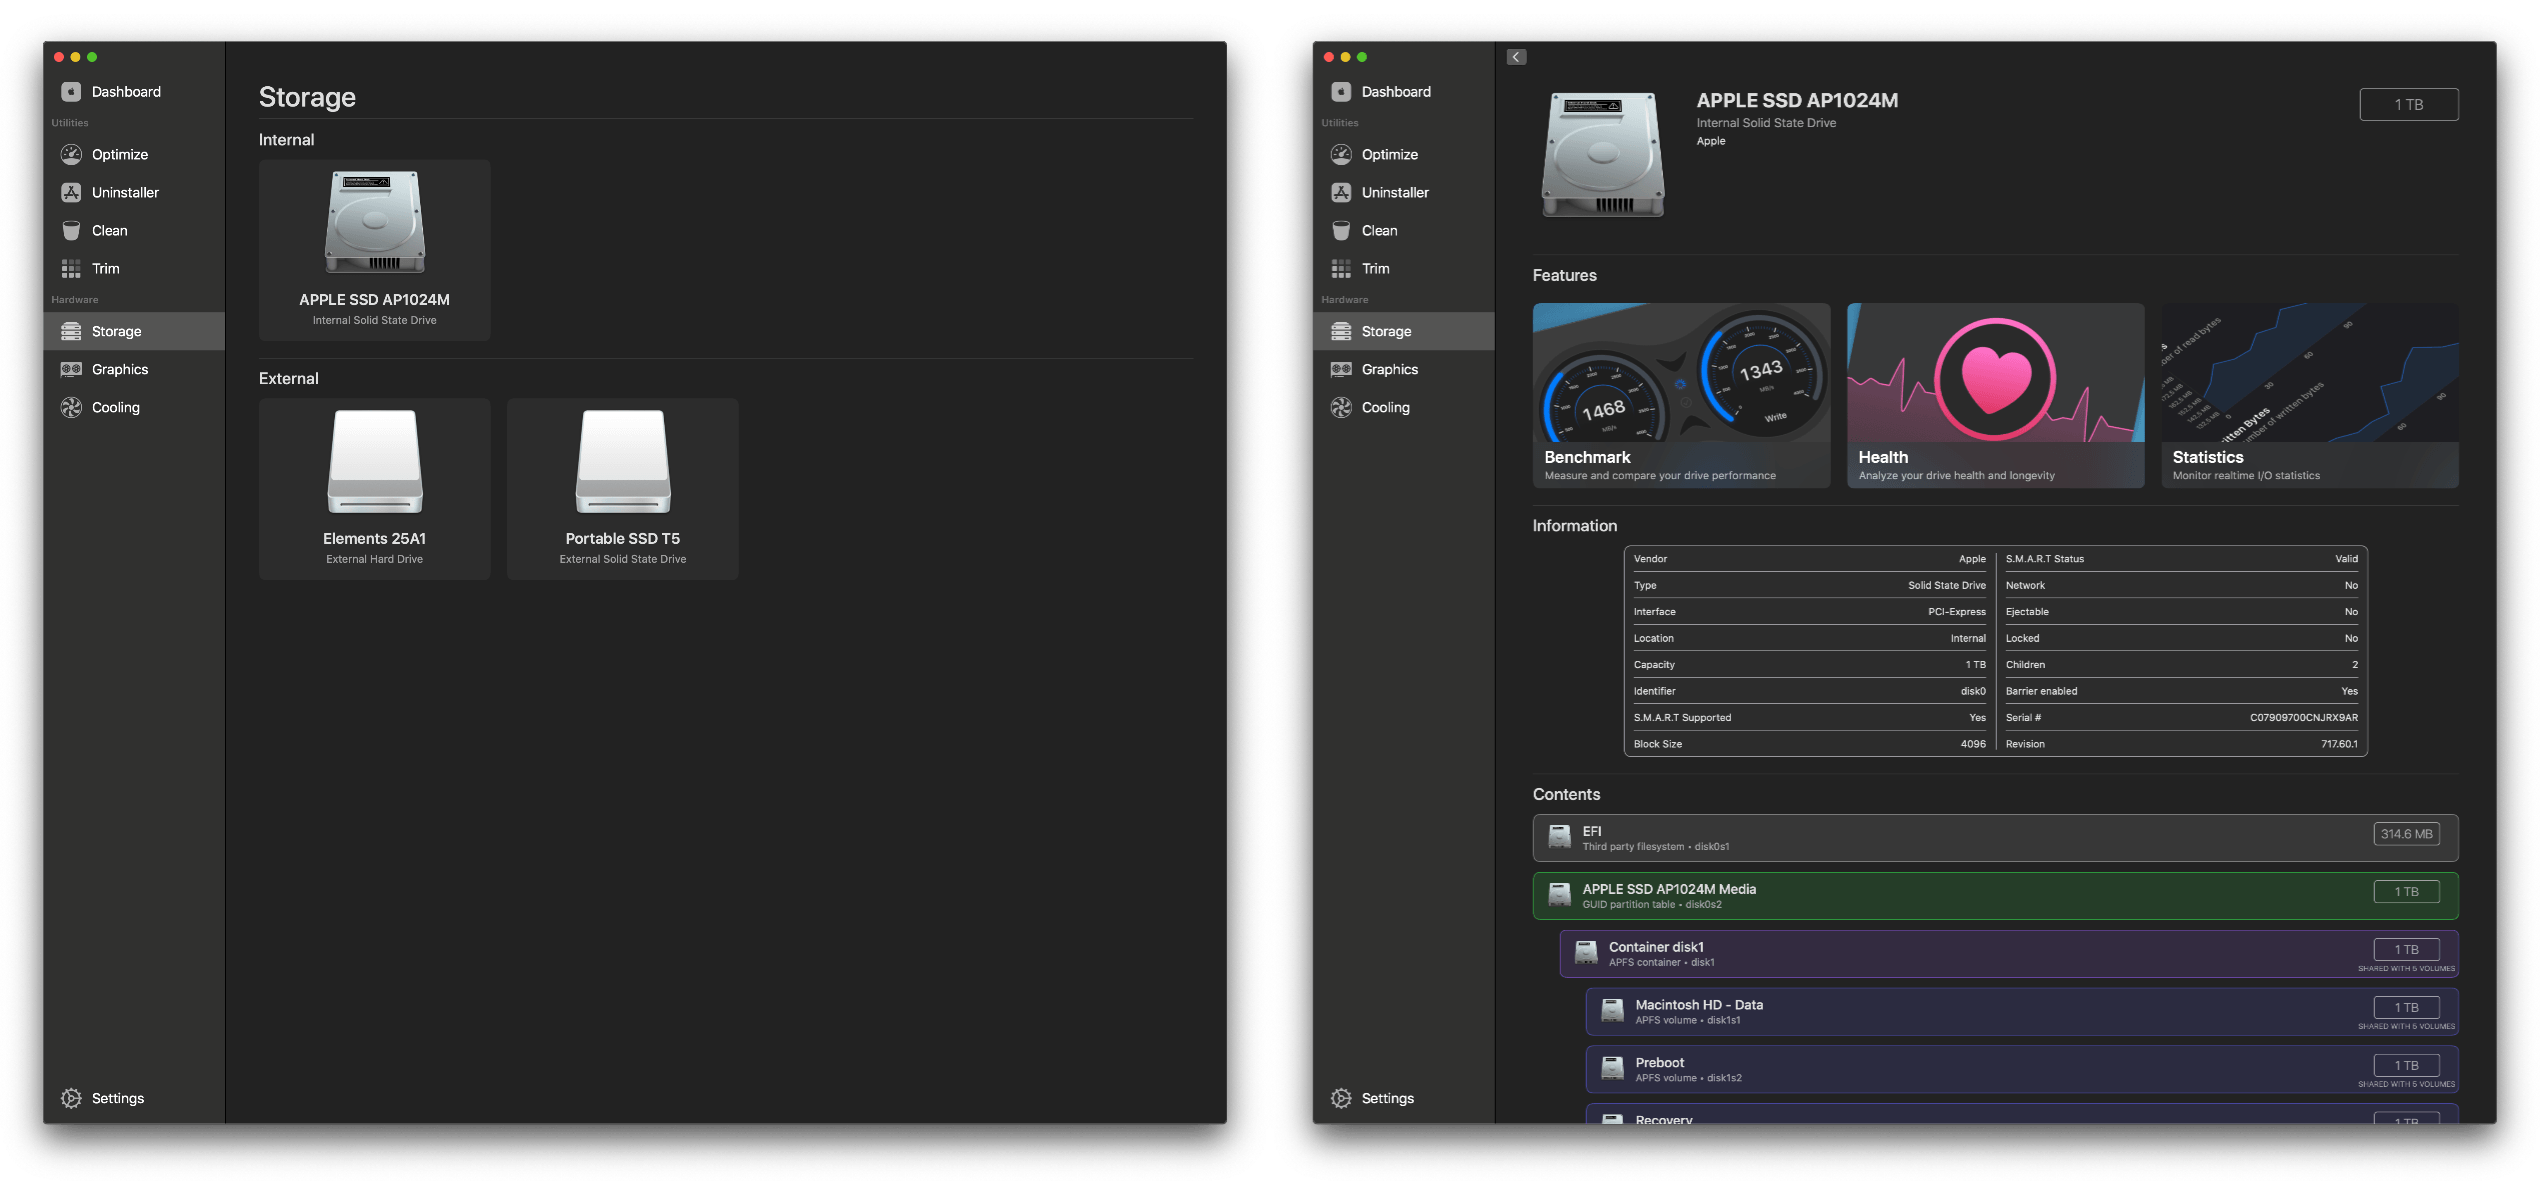
The remainder of Sensei is dedicated to a deeper dive into your Mac’s hardware. The Storage section is divided between internal and external storage. Clicking on any drive provides detail about the drive and its contents, plus access to a read/write benchmark test, S.M.A.R.T.-based drive health statistics, which only worked with my internal SSD, and graphs of multiple drive metrics such as read and write operations.
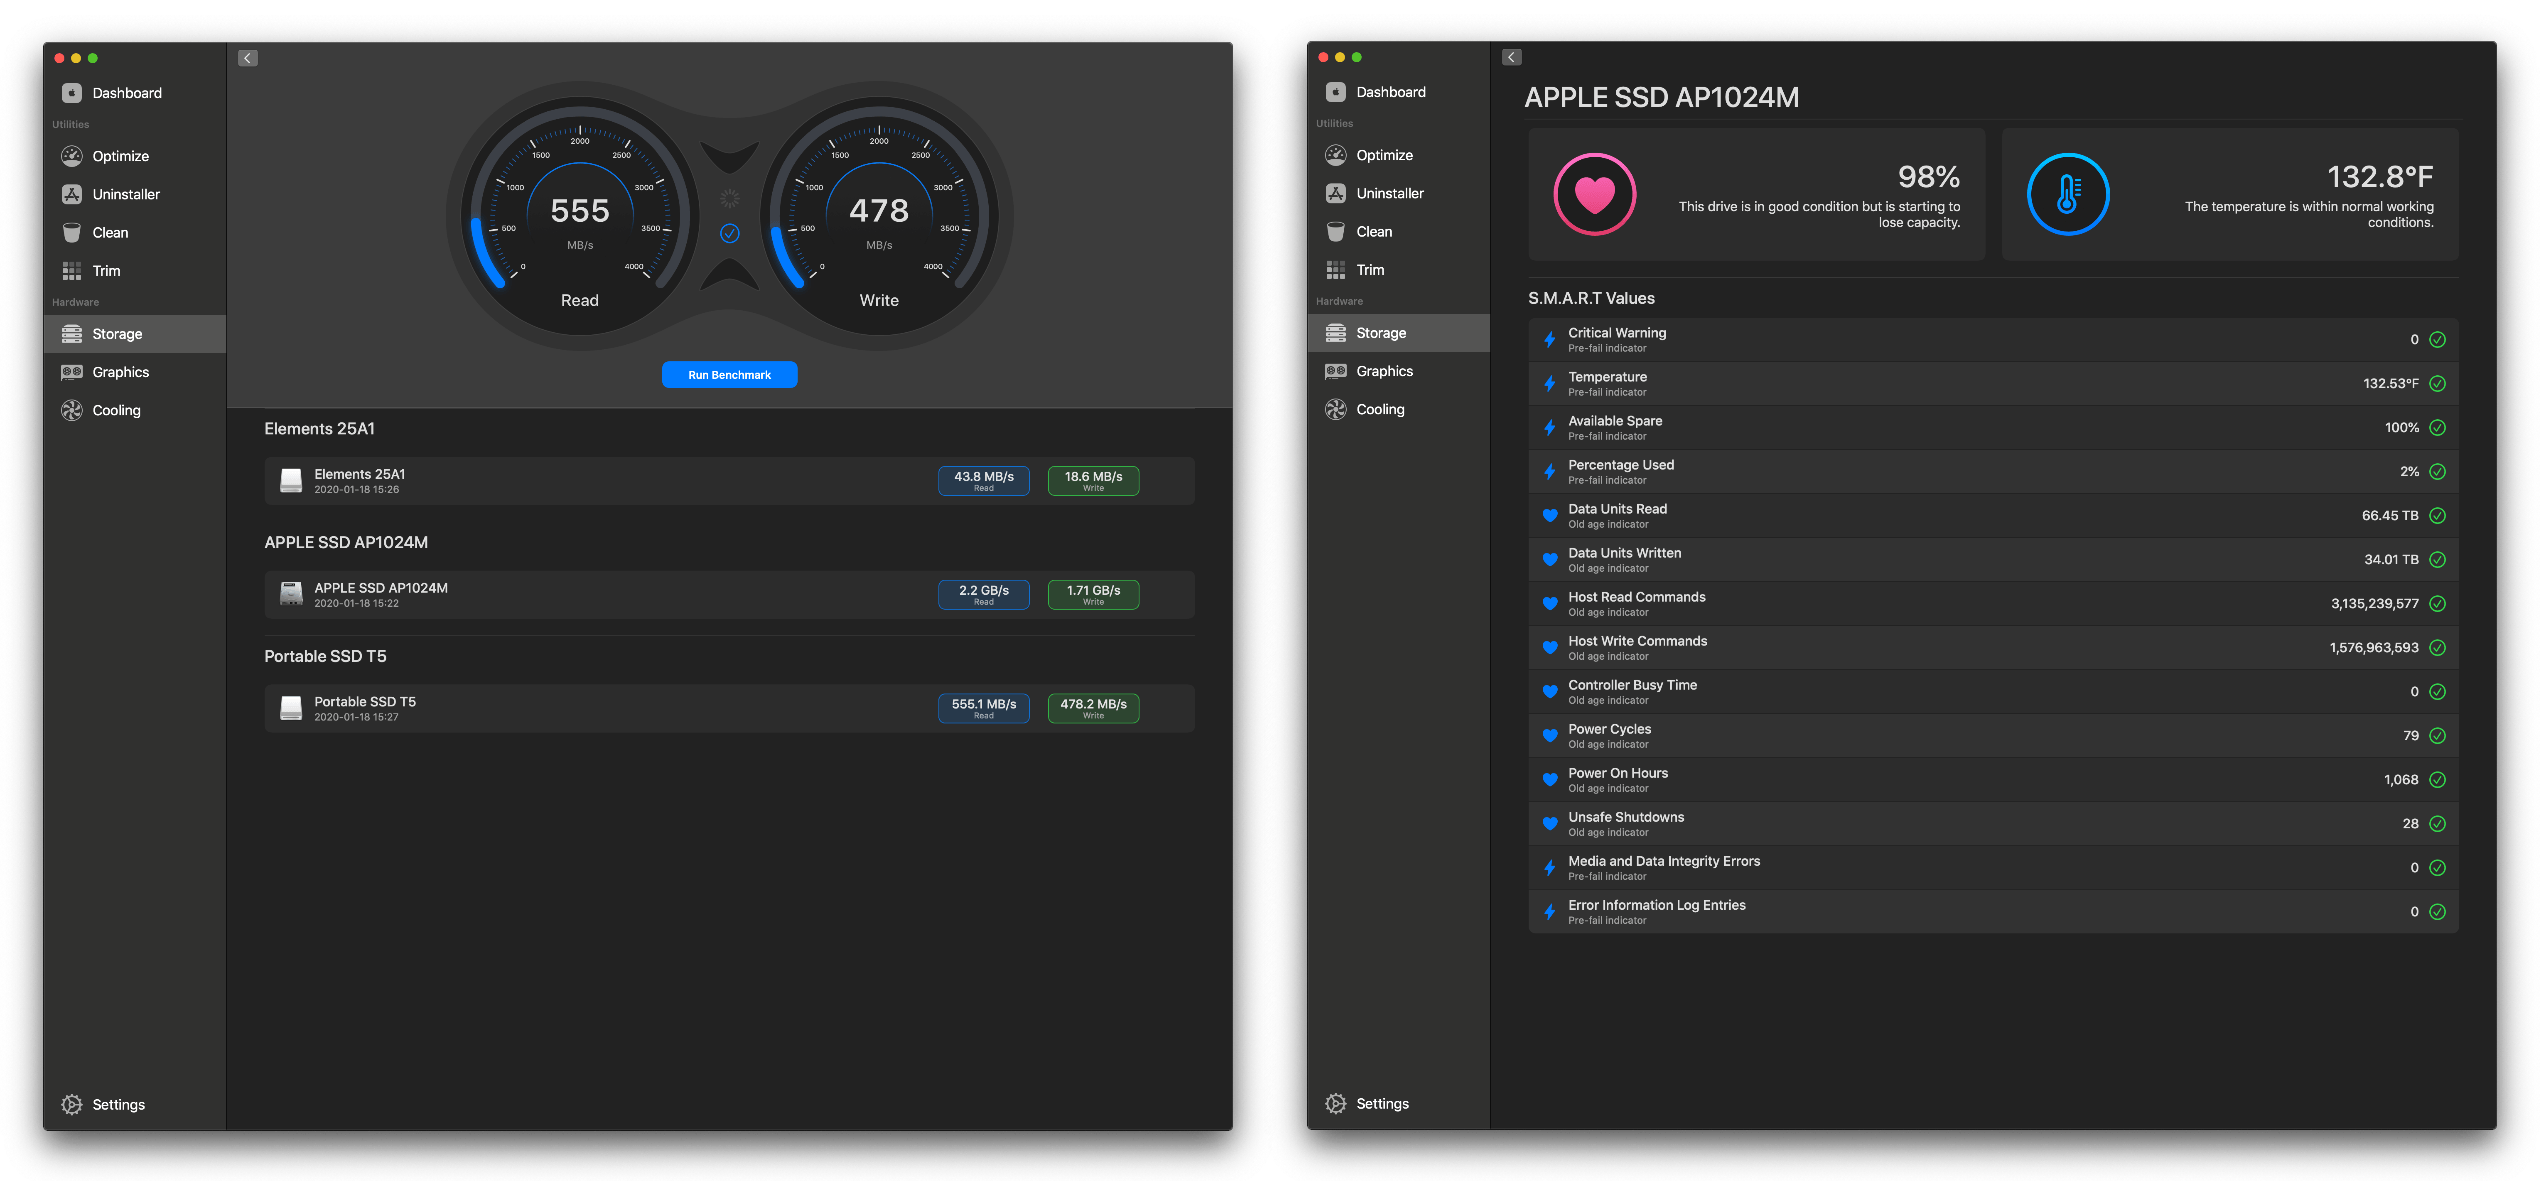
The benchmarks provided a revealing look at the relative speed of the external drives connected to my Mac as compared to the internal SSD. It was also comforting to see my internal SSD passed all the S.M.A.R.T. tests.
However, the long list of statistics that Sensei reports raises an issue that I have with every app like it that I’ve used, which is that without context, it’s hard to understand what’s being reported. I’d love to see additional reference material added to Sensei that explains the relevance of the data it provides and what it can reveal about your Mac. I understand that the answer in many cases is probably ‘it depends,’ but I’d like to see Sensei take a stab at it.
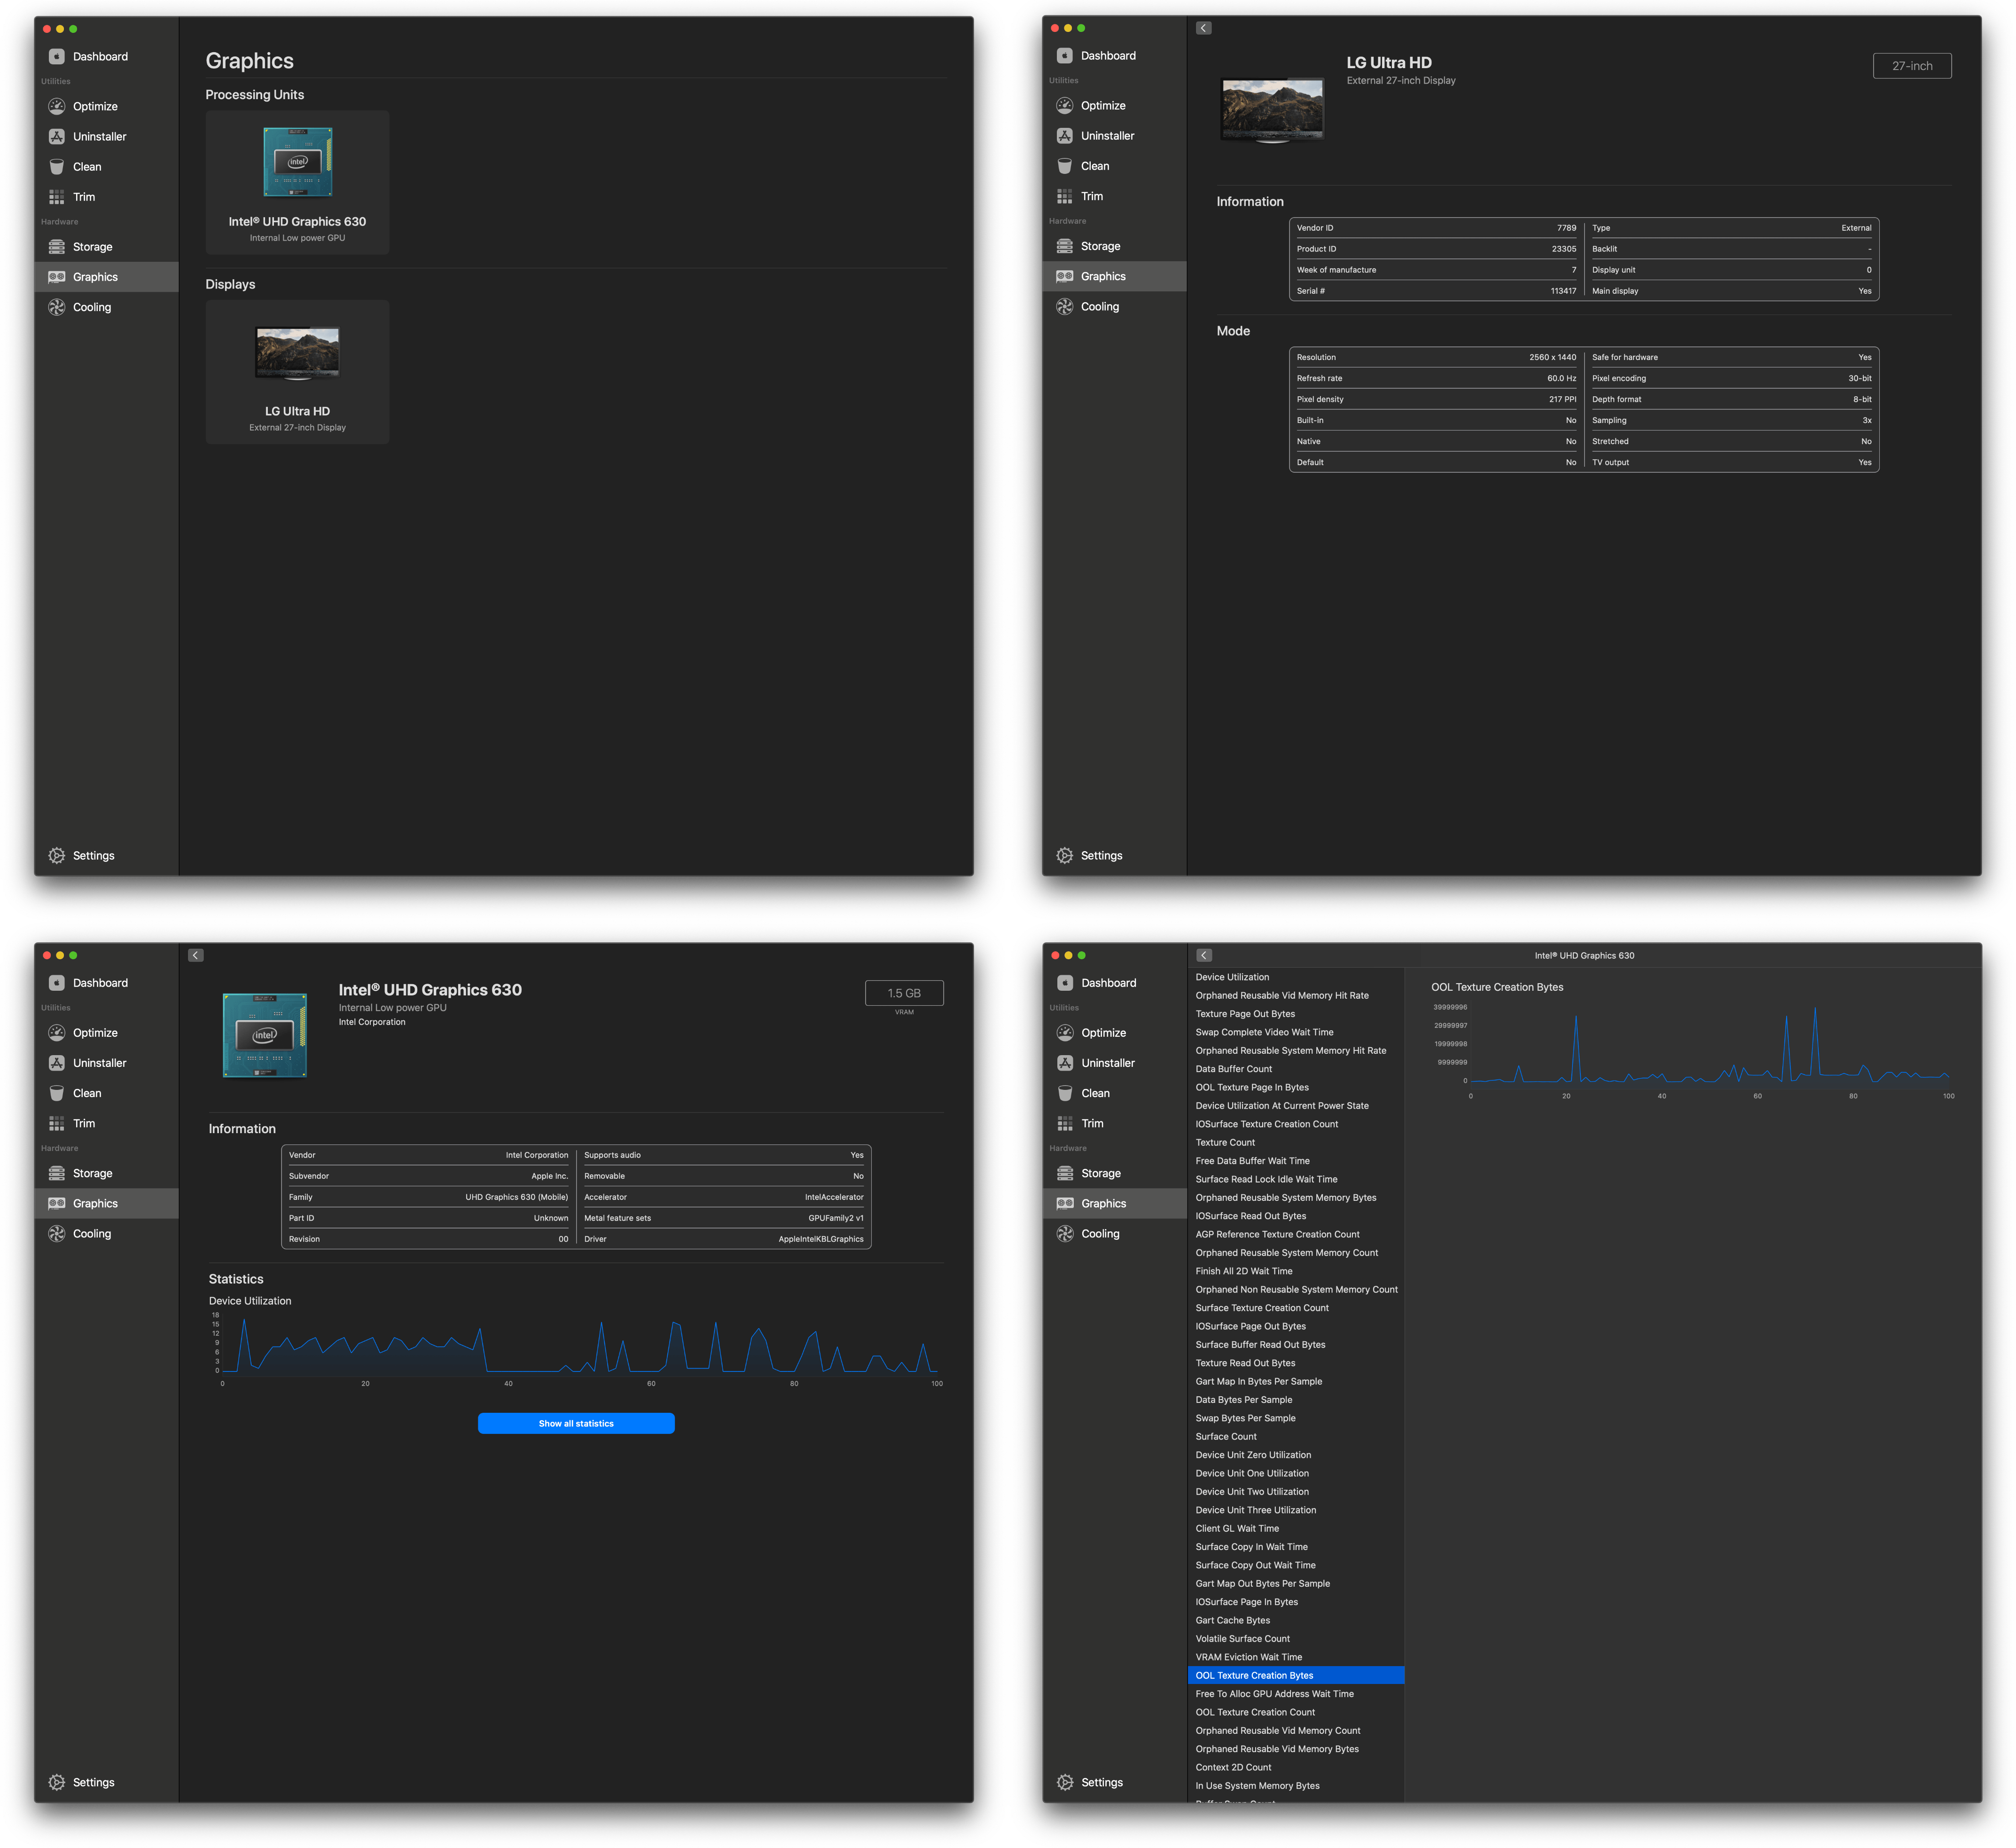
The graphics section is divided into Processing Units and Display sections. The Processing Units section displays basic information about your GPU and a real-time graph of its utilization. There are also over 70 different metrics tracked if you want additional details. The Display data includes basic information about the display connected to your Mac and the mode in which it’s running.
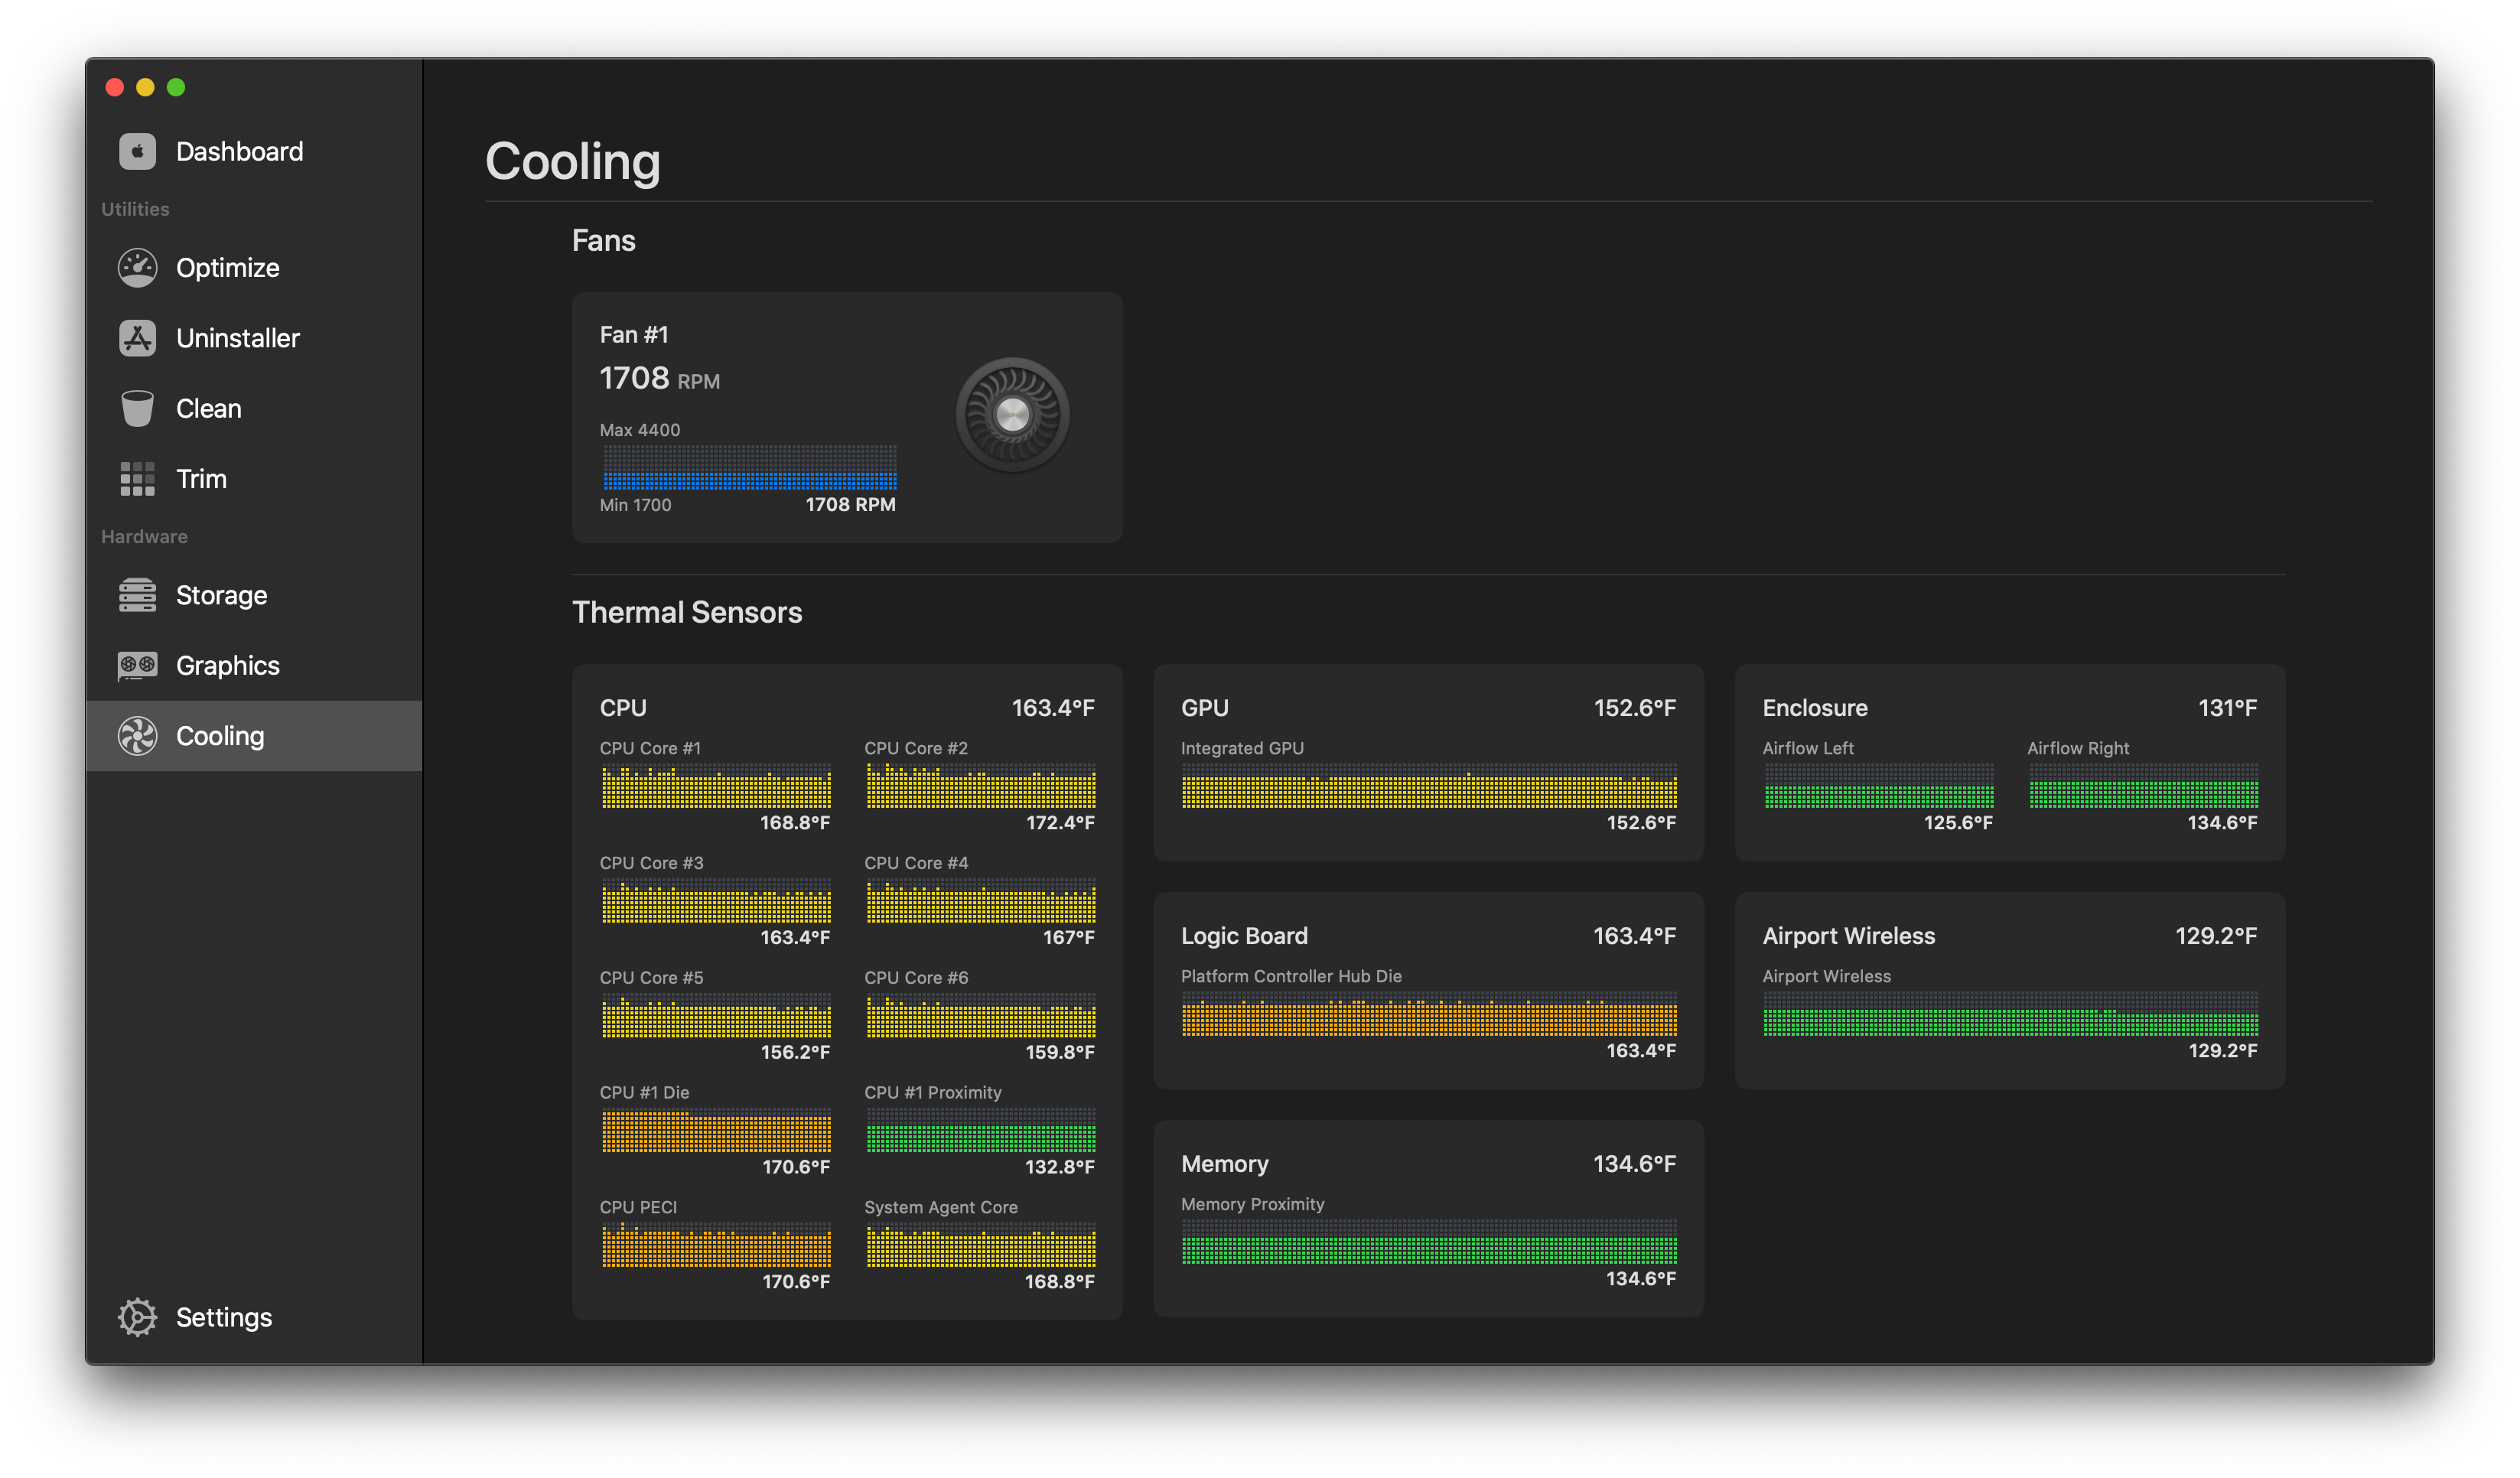
The final section of Sensei tracks cooling and includes real-time temperature data on your fan’s RPMs as well as its CPU, GPU, logic board, memory, enclosure, and AirPort wireless temperatures. Each graph is color-coded from blue to red to depict how hot each is running. Again, it’s a little hard to interpret the data without context. My Mac mini is warm to the touch whether or not I’m using it, but I did try one experiment that was revealing.
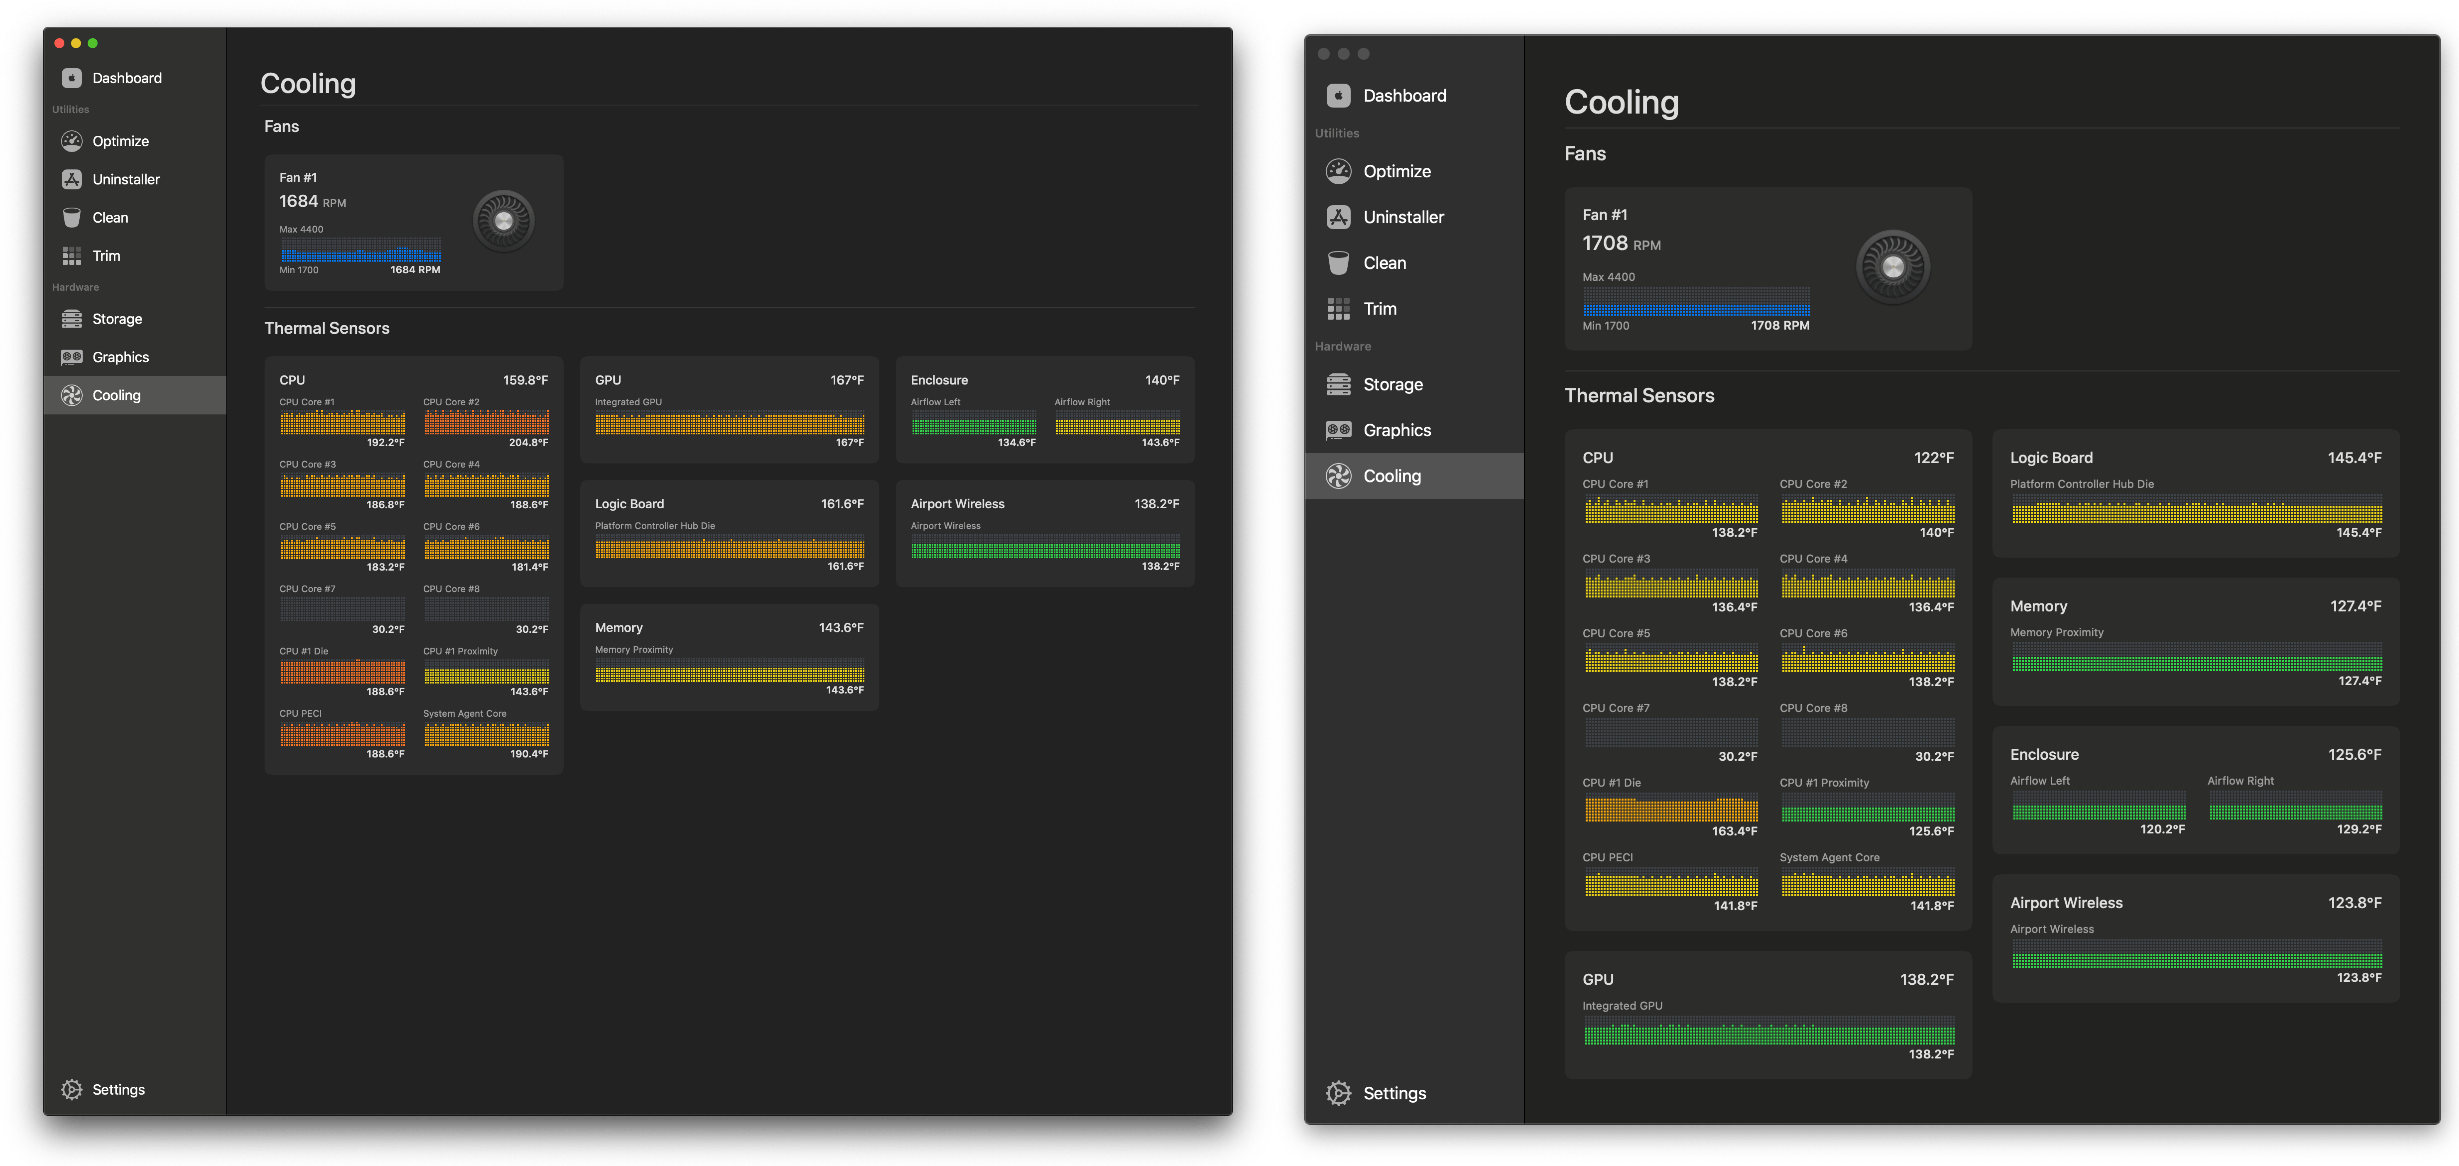
I’ve been using a Satechi hub that fits neatly beneath my Mac mini for a couple of months. The hub provides USB-A, USB-C, audio, and SD and micro SD card access at the front of the mini, which is convenient. However, I’ve noticed my mini’s fans spinning up audibly a lot lately, even when I’m not doing much with my Mac, which led me to wonder if the hub was part of the issue. I took a screenshot of the temperature readings with the hub attached and another after I removed it, and sure enough, the mini ran cooler after I removed the hub.
The Satechi hub has pass-through vents that line up with the vents underneath the mini, but it still ran noticeably cooler without the hub attached, which led me to switch to a hub that sits next to my mini instead. Temperature is affected by what you’re doing on your Mac, and some of the difference could have been related to what I was doing immediately before each screenshot, but there was enough of a difference that I decided that swapping out the hub was worth a try. So far, my mini seems to be running cooler overall.
I ran into a few rough edges with Sensei and would like to see the app add context for the data that it tracks, but that doesn’t diminish my enthusiasm for it. The app does an excellent job reporting the data it tracks. With a quick glance, I can get a sense of how my Mac’s resources are being used and whether something out of the ordinary is happening, which has already led me to alter my setup to reduce the heat inside my Mac mini. Other apps are available that do the same thing or more, but I especially like the balance of what is reported and how it is displayed in Sensei. It’s a fantastic 1.0 that I hope continues to get updates that add additional information, utilities, and context to what is already available.
Sensei is available as a subscription for $29/year or as a lifetime license for $59.